
 mfleming
The Linux x86 ORC Stack Unwinder
No one wants their Linux machine to crash. But when it does, providing as much information as possible to the upstream developers helps to ensure it doesn’t happen again. Fixing the bug requires that developers understand the state of your machine at the time of the crash. One of the most critical clues for debugging is the stacktrace, produced by the kernel’s stack unwinder. But the kernel’s unwinders are not reliable 100% all of the time. The x86 ORC unwinder patch series, posted to the Linux kernel mailing list by Josh Poimboeuf, aims to change that.
The Purpose of Stack Unwinders
If your Linux machine crashes, kernel developers want to know the execution path that led to the crash because it helps them to debug and fix the root cause. A stack unwinder’s job is to figure out how a process reached the current machine instruction. This sequence is known as a stacktrace or callgraph. It is a list of functions that were entered (but not exited) on the way to the current instruction.
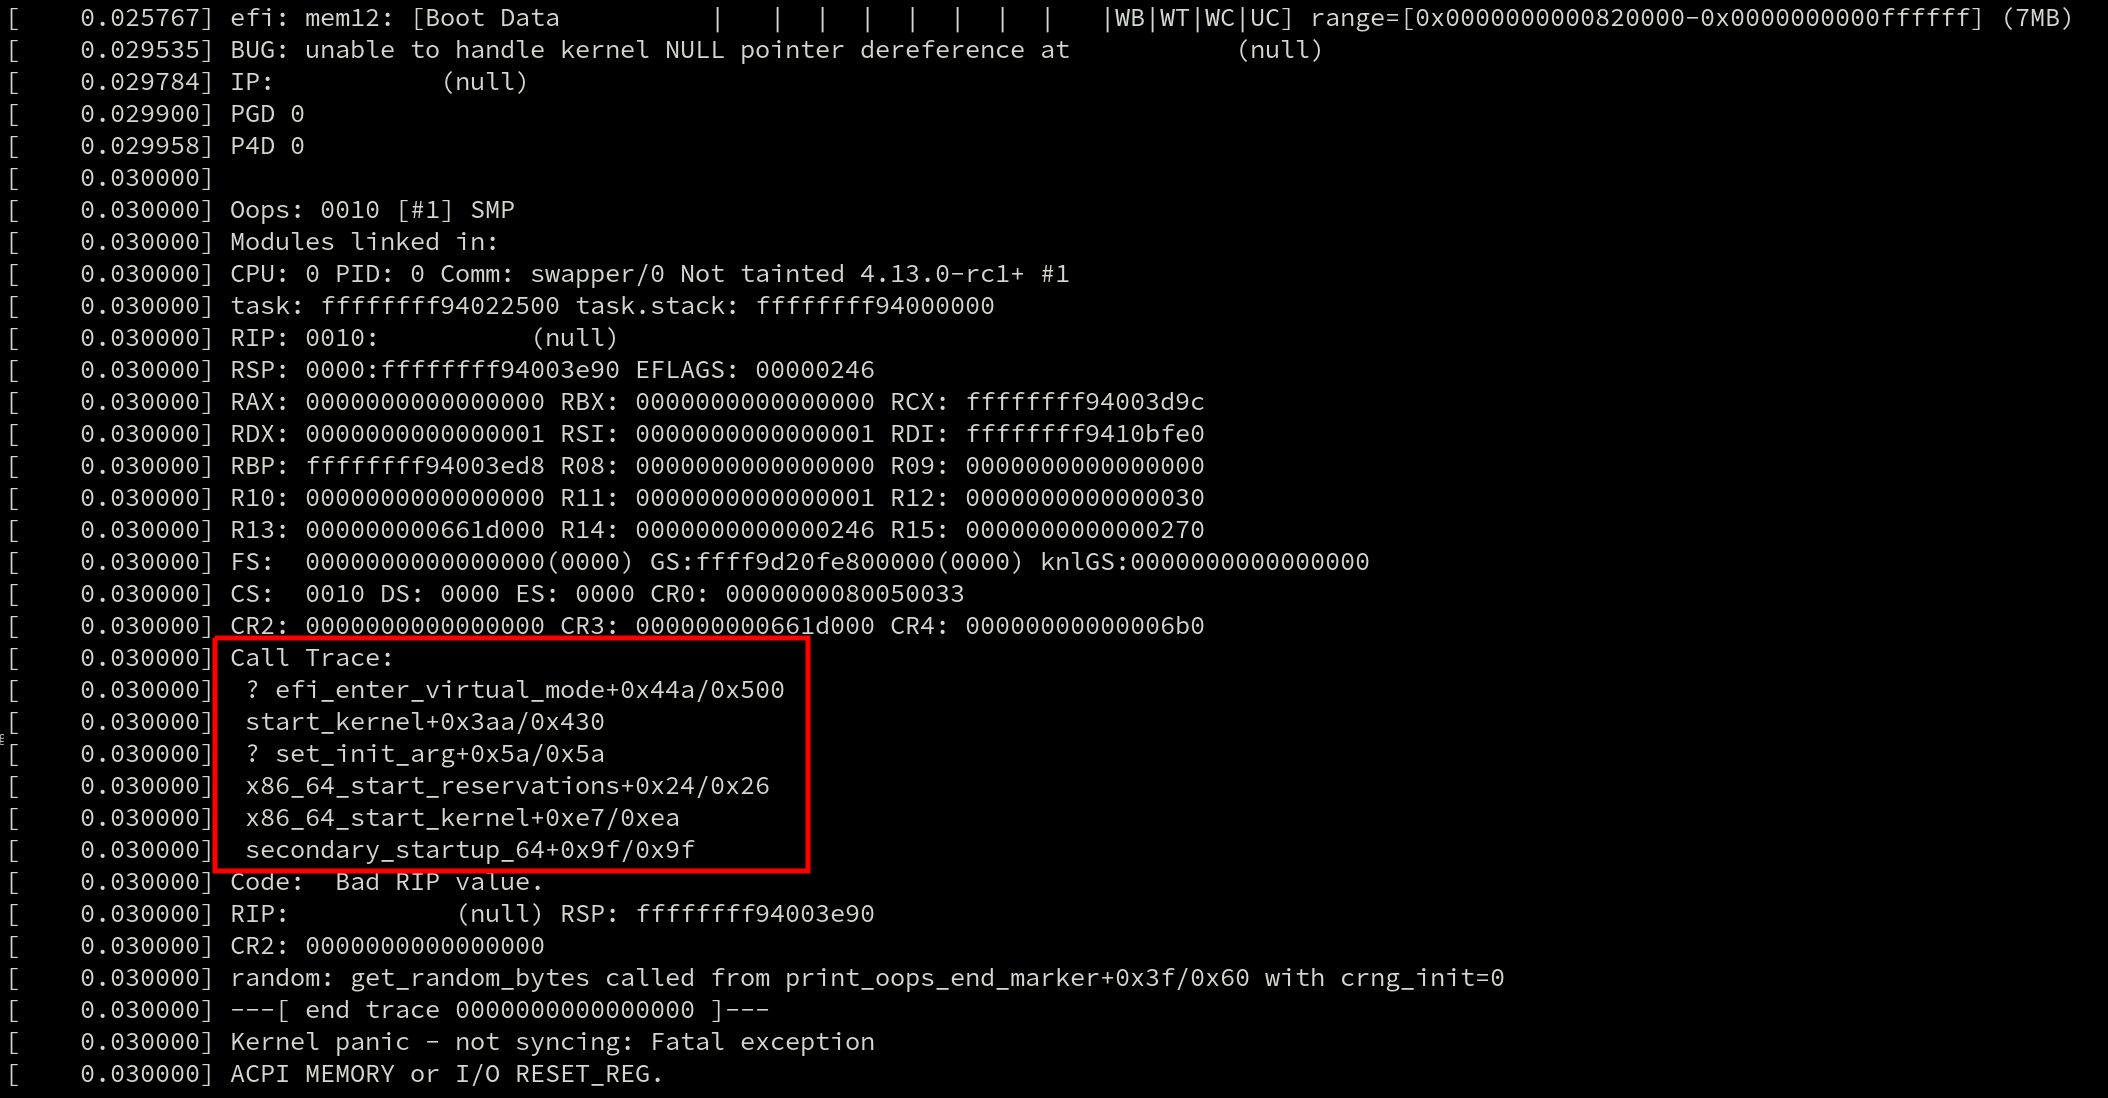
When a crash occurs, a callgraph is displayed in the Oops message. Here’s an example with the callgraph highlighted by a red box.
They’re also used by profilers such as perf and ftrace. Even live patching requires generating a callgraph because tasks can only be moved to the new (patched) version of a function if they’re not currently inside of the old one. And that requires searching for the function in the task’s callgraph.
Stack unwinders also exist outside of the kernel and callgraphs can be generated by debuggers like gdb for debugging live applications and to post-process coredumps.
With so many uses, there are plenty of developers that have an interest in ensuring stack unwinders work well. The two most prominent attributes of an unwinder are how quickly it can generate a callgraph, and how accurate that callgraph is.
As of Linux v4.12, there are multiple x86 unwinders: the guess and frame pointer unwinders. The guess unwinder is extremely simple and makes a guess at the callgraph by looking for instruction addresses on the stack. Its accuracy leaves a lot to be desired.
A far more robust stack unwinder is the frame pointer unwinder.
The Frame Pointer and DWARF Unwinders
The frame pointer unwinder is the current default for x86 in the mainline kernel. It requires support from the compiler which uses the rules described in the x86-64 ABI to save the address of the previous stack frame in the %rbp register at the start of every function (the prologue). When the kernel is compiled with this option the %rbp register is only used for that one purpose, and not for general use.
Stack frames are chained together by copying the value of %rbp to the current stack frame before the register is overwritten. Because the stack frames have a fixed layout – and because the function return addresses are at a known offset inside the stack frames – unwinding the stack then simply requires some arithmetic and pointer dereferencing; this is the reason that the frame pointer unwinder is so fast.
One of the downsides of the frame pointer unwinder is that using it introduces a runtime overhead for every function in the kernel. Regardless of whether a crash occurs there or not, every function prologue is modified to save the address of the stack frame in %rbp and restore the previous %rbp value in the epilogue before returning. In the cover letter for the ORC series, Poimboeuf reported that the kernel text size increases by 3.2% when GCC’s frame pointer option is enabled.
For some workloads, this overhead can be significant. Mel Gorman reported that enabling the GCC’s frame pointer option has been observed to add between 5% and 10% overhead when running benchmarks like netperf, [page allocator microbenchmark (run via SystemTap), pgbench and sqlite due to “a small amount of overhead added everywhere”. The overhead is caused by an increase in CPU cycles due to the additional instructions in every function prologue and epilogue, which bloats the kernel text size, and ultimately causes more instruction-cache misses.
The frame pointer unwinder can also have trouble unwinding a stack across the kernel-user boundary – it can be a major problem when using perf to profile an application. If the kernel was compiled with the frame pointers enabled, the application and every library it uses also needs to have been compiled with frame pointers enabled. Most Linux distributions do not compile their software with frame pointers enabled, and users have to result to building their software stacks by hand with custom compiler options if they want full callgraphs.
Finally, frame pointer unwinding is not reliable across exceptions and interrupts. Interrupts can occur at any point, including before the %rbp register has been written to. When that happens, the frame pointer unwinder is unable to calculate the callgraph. This results in inaccurate stacktraces in an Oops message, and impacts the ability to live patch which requires reliable stacktraces.
One unwinder that is reliable across interrupts is the DWARF unwinder. The DWARF unwinder generates a callgraph by parsing the DWARF Call Frame Information (CFI) tables that are emitted by the compiler.
DWARF was invented for debugging applications and callgraph generation is only a small part of that. DWARF is a very sophisticated debugging format. It can describe the state of a machine’s registers at any instruction with the use of a complex state machine.
Because the DWARF debuginfo lives in data tables the data used by the unwinder is out-of-band and can be distributed as a separate file. This is exactly what many Linux distributions do with their kernels. This completely eliminates the runtime overhead except for those users that want to debug a crash or profile a task; this is in stark contrast to the frame pointer unwinder.
The catch? There is no DWARF unwinder in the mainline Linux kernel for x86. Separate tools like gdb must be used to post-process crash dumps and generate callgraphs for kernels built with DWARF debuginfo, making it impossible to use DWARF for Oops messages, live patching, perf and ftrace.
Many years ago, there was a DWARF unwinder in the kernel but it was removed after developers discovered bugs that caused the oops code to crash – crashing inside the crash handler does not fulfill the promise of a more reliable unwinder. A recent series from Jiri Slaby that added the DWARF unwinder currently carried in SUSE’s kernel brought up a lot of the historical issues.
Some of those were caused by missing or incorrect DWARF information generated by GCC. Linus replied to Slaby’s patch and retold some of the problems with GCC’s DWARF debuginfo: “nobody actually really depended on it, and the people who had tested it seldom did the kinds of things we do in the kernel (eg inline asms etc).”
While the compiler can automatically generate the DWARF debguinfo for C code, anything written in assembly (there are over 50,000 lines in the x86 source) must be hand-annotated. Even after the original DWARF unwinder was removed, annotations remained in the x86 assembly code for years. But eventually their maintenance burden became too much and they were deleted by Ingo Molnar in during the v4.2 merge window.
Linus was clear that no DWARF unwinder would be allowed in the kernel: “Because from the last time we had fancy unwindoers [sic], and all the problems it caused for oops handling with absolutely zero_ upsides ever, I do not ever again want to see fancy unwinders with complex state machine handling used by the oopsing code.”
Enter the ORC Unwinder
It was in the middle of this discussion that Poimboeuf discussed the possibility of a new unwinder and debug format. The proposed solution is the ORC unwinder.
It creates a brand new custom debuginfo format using objtool and the existing stack validation work. The ORC format is smaller, and therefore, much simpler than DWARF which means no complex state machine is required in the unwinder.
Plus, with the format entirely controlled by the kernel community, it should provide both the reliability guarantees (no bugs in debuginfo causing crashes) and low-maintenance overhead (since it doesn’t require hand-annotating assembly code) that are missing with DWARF. Interrupts and exceptions are handled reliably with the ORC unwinder.
Like DWARF, but unlike frame pointers, the data is out-of-band and doesn’t increase the kernel text size, though Poimboeuf says enabling the ORC unwinder requires adding 2-4MB of ORC debuginfo which will increase the size of the data sections in the kernel image.
As Poimboeuf explains in his cover letter when comparing ORC and frame pointers: “In contrast, the ORC unwinder has no effect on text size or runtime performance, because the debuginfo is out of band. So if you disable frame pointers and enable the ORC unwinder, you get a nice performance improvement across the board, and still have reliable stack traces.”
The simplicity of the ORC unwinder also makes it faster. Jiri Slaby demonstrated that undwarf is 20x faster than DWARF unwinder. Performance tweaks have been added since and Poimboeuf speculates that the speed up may now be closer to 40x.
The Name
Until version v3 of the patch series the unwinder went by the name “undwarf”. After Poimboeuf said he wasn’t tied to the name, Ingo Molnar suggested some alternatives that were riffs on the ELF, DWARF tune. Poimboeuf took the Middle Earth theme and ran with it, finally settling on ORC aftering reading the Middle-earth peoples article on Wikipedia: “Orcs, fearsome creatures of medieval folklore, are the Dwarves’ natural enemies. Similarly, the ORC unwinder was created in opposition to the complexity and slowness of DWARF.” The backronym of ORC is “Oops Rewind Capability”.
How it works
All stack unwinders that use out-of-band data need some mechanism for generating that data. ORC uses objtool to build unwind tables which are built into the kernel image at link time, when a new kernel is built. The in-kernel ORC unwinder processes the unwind tables whenever a callgraph needs to be generated.
The stack validation tool is used to analyze all of the instructions in an object file and build unwind tables to describe the state of the stack for at each instruction address. This data is written to two parallel arrays, .orc_unwind and .orc_unwind_ip. Using two sections allows for a faster lookup of ORC data for a given instruction address because the searchable part of the data (.orc_unwind_ip) is more compact.
The tables consist of struct orc_entry elements, which describe how to locate the previous function’s stack and frame pointers. Each element corresponds to one or more code locations.
The existing x86 unwinder infrastructure that supports the frame pointer and guess unwinders already provides most of the code required for the ORC unwinder. As a rough measure of unwinder complexity, the number of lines of C required to implement each of the unwinders (frame pointer: 391, ORC: 582, DWARF: 1802) puts the ORC unwinder closer to frame pointer than DWARF.
Future Work
The ORC unwinder certainly shows promise. But it is still missing a few important features that will prevent it from becoming the default unwinder in the kernel.
For one, it doesn’t have stack reliability checks, which means it cannot be used with live patching. Live patching performs runtime checks and decides when it’s safe to patch a function by checking for the presence of a function in a task’s callgraph. But the improved reliability across interrupts and exceptions that ORC provides will likely make reliabilty checks a high priority item.
Support for dynamically generated code such as from ftrace and BPF is missing too.
And since ORC is an in-kernel unwinder, there is no support in the perf tool for generating callgraphs using ORC in userspace. Poimboeuf suggested that adding it should be possible: “If you want perf to be able to use ORC instead of DWARF for user space binaries, that’s not currently possible, though I don’t see any technical blockers for doing so. Perf would need to be taught to read ORC data.”
Based on the majority of comments so the ORC unwinder series so far, it seems likely that it will be merged for the v4.14 timeframe. Whether or not it will be enabled by default still remains to be seen – many developers, including Linus, vividly remember the last time a new unwinder was used in the Oops code. The hope is that orcs will prove more reliable than dwarves.

Testing with os/exec and TestMain
If you look at the
tests for
the Go standard library’s os/exec package, you’ll find a neat trick
for how it tests execution:
func helperCommandContext(t *testing.T, ctx context.Context, s ...string) (cmd *exec.Cmd) {
    testenv.MustHaveExec(t)

    cs := []string{"-test.run=TestHelperProcess", "--"}
    cs = append(cs, s...)
    if ctx != nil {
        cmd = exec.CommandContext(ctx, os.Args[0], cs...)
    } else {
        cmd = exec.Command(os.Args[0], cs...)
    }
    cmd.Env = []string{"GO_WANT_HELPER_PROCESS=1"}
    return cmd
}

// TestHelperProcess isn't a real test.
//
// Some details elided for this blog post.
func TestHelperProcess(*testing.T) {
    if os.Getenv("GO_WANT_HELPER_PROCESS") != "1" {
        return
    }
    defer os.Exit(0)

    args := os.Args
    for len(args) > 0 {
        if args[0] == "--" {
            args = args[1:]
            break
        }
        args = args[1:]
    }
    if len(args) == 0 {
        fmt.Fprintf(os.Stderr, "No command\n")
        os.Exit(2)
    }

    cmd, args := args[0], args[1:]
    switch cmd {
    case "echo":
        iargs := []interface{}{}
        for _, s := range args {
            iargs = append(iargs, s)
        }
        fmt.Println(iargs...)

    //// etc...
    }
}
When you run go test, under the covers the toolchain compiles your
test code into a temporary binary and runs it. (As an aside, passing
-x to the go tool is a great way to learn what the toolchain is
actually doing.)
This helper function in exec_test.go sets a GO_WANT_HELPER_PROCESS
environment variable and calls itself with a parameter directing it
to run a specific test, named TestHelperProcess.
Nate Finch wrote an excellent blog post in 2015 on this pattern in greater detail, and Mitchell Hashimoto’s 2017 GopherCon talk also makes mention of this trick.
I think this can be improved upon somewhat with the
TestMain mechanism
that was added in Go 1.4, however.
Here it is in action:
package myexec

import (
    "fmt"
    "os"
    "os/exec"
    "strings"
    "testing"
)

func TestMain(m *testing.M) {
    switch os.Getenv("GO_TEST_MODE") {
    case "":
        // Normal test mode
        os.Exit(m.Run())

    case "echo":
        iargs := []interface{}{}
        for _, s := range os.Args[1:] {
            iargs = append(iargs, s)
        }
        fmt.Println(iargs...)
    }
}

func TestEcho(t *testing.T) {
    cmd := exec.Command(os.Args[0], "hello", "world")
    cmd.Env = []string{"GO_TEST_MODE=echo"}
    output, err := cmd.Output()
    if err != nil {
        t.Errorf("echo: %v", err)
    }
    if g, e := string(output), "hello world\n"; g != e {
        t.Errorf("echo: want %q, got %q", e, g)
    }
}
We still set an environment variable and self-execute, but by moving
the dispatching to TestMain we avoid the somewhat-hacky special test
which only ran when a certain environment variable is set, and which
needed to do extra command-line argument handling.
Update: Chris Hines wrote about
this and other useful things
you can do with TestMain in a post from 2015 that I did not know
about!
Increase the thread/process limit for Chrome and Chromium to prevent “unable to create process” errors
Browsers like Chrome, Chromium and Mozilla Firefox have moved to running tabs in separate threads and processes, to increase performance and responsiveness and to reduce the effects of crashes in one tab.
Occasionally, this exhausts the default limit on the amount of processes and threads that a user can have running.
Determine the maximum number of processes and threads in a user session:
$ ulimit -u

1200
The SUSE defaults are configured in /etc/security/limits.conf:
# harden against fork-bombs

*               hard    nproc           1700

*               soft    nproc           1200

root            hard    nproc           3000

root            soft    nproc           1850
In the above, * the catch-all for all users.
To raise the limit for a particular user, you can either edit /etc/security/limits.conf or create a new file /etc/security/limits.d/nproc.conf. Here is an example for /etc/security/limits.d/nproc.conf raising the limit for the user jdoe to 8k/16k threads and processes:
jdoe        soft    nproc   8192

jdoe        hard    nproc   16384
If you want to do that for a whole group, use the @ prefix:
@powerusers        soft    nproc   8192

@powerusers        hard    nproc   16384
In either case, this change is effective only for the next shell or login session.
 Member
Ruby gems security issues: Have hackers lost their interest?
Is it because ruby programming community has gotten more mature? Are developers better? Or is it that hackers and researchers have lost interest?
Whatever it is, here you have the numbers:

*data from https://github.com/rubysec/ruby-advisory-db
opendev: OpenStack Foundation failed to learn the lesson
Reminder: OpenStack Summit Sydney - CFP Deadline


Legacy Systems as Old Cities
I just realized that I only tweeted about this a couple of months ago, but never blogged about it. Shame on me!
I wrote an article, Legacy Systems as Old Cities, for The Recompiler magazine. Is GNOME, now at 20 years old, legacy software? Is it different from mainframe software because "everyone" can change it? Does long-lived software have the same patterns of change as cities and physical artifacts? Can we learn from the building trades and urbanism for maintaining software in the long term? Could we turn legacy software into a good legacy?
You can read the article here.
Also, let me take this opportunity to recommend The Recompiler magazine. It is the most enjoyable technical publication I read. Their podcast is also excellent!
Update 2017/06/10 - Spanish version of the article, Los Sistemas Heredados como Ciudades Viejas
Setting Alt-Tab behavior in gnome-shell
After updating my distro a few months ago, I somehow lost my tweaks to the Alt-Tab behavior in gnome-shell.
The default is to have Alt-Tab switch you between applications in the
current workspace. One can use Alt-backtick (or whatever key you
have above Tab) to switch between windows in the current application.
I prefer a Windows-like setup, where Alt-Tab switches between
windows in the current workspace, regardless of the application to
which they belong.
Many moons ago there was a gnome-shell extension to change this behavior, but these days (GNOME 3.24) it can be done without extensions. It is a bit convoluted.
With the GUI
If you are using X instead of Wayland, this works:
-
Unset the Switch applications command. To do this, run
gnome-control-center, go to Keyboard, and find the Switch applications command. Click on it, and hitBackspacein the dialog that prompts you for the keyboard shortcut. Click on the Set button. -
Set the Switch windows command. While still in the Keyboard settings, find the Switch windows command. Click on it, and hit
Alt-Tab. Click Set.
That should be all you need, unless you are in Wayland. In that case, you need to do it on the command line.
With the command line, or in Wayland
The kind people on #gnome-hackers tell me that as of GNOME
3.24, changing Alt-Tab doesn't work on Wayland as in (2) above,
because the compositor captures the Alt-Tab key when you type it
inside the dialog that prompts you for a keyboard shortcut. In that
case, you have to change the configuration keys directly instead of
using the GUI:
gsettings set org.gnome.desktop.wm.keybindings switch-applications "[]"
gsettings set org.gnome.desktop.wm.keybindings switch-applications-backward "[]"
gsettings set org.gnome.desktop.wm.keybindings switch-windows "['<Alt>Tab', '<Super>Tab']"
gsettings set org.gnome.desktop.wm.keybindings switch-windows-backward  "['<Alt><Shift>Tab', '<Super><Shift>Tab']"
Of course the above also works in X, too.
Changing windows across all workspaces
If you'd like to switch between windows in all workspaces, rather than
in the current workspace, find the org.gnome.shell.window-switcher
current-workspace-only GSettings key and change it. You can do this
in dconf-editor, or on the command line with
gsettings set org.gnome.shell.window-switcher current-workspace-only true

golang range Tickers
Yesterday Praveen sent me an interesting piece of golang code. Read the following code and tell what the answer will be:
===
type LED struct {
state bool
ticker *time.Ticker
}
func toggle(led *LED) {
led.state = !led.state
}
func looper(led *LED) {
for range led.ticker.C {
toggle(led)
}
}
func main() {
fmt.Println("Initial number of GoRoutines: ", runtime.NumGoroutine())
led := &LED{state: true, ticker: time.NewTicker(time.Millisecond * 500)}
go looper(led)
fmt.Println("Number of GoRoutines after a call to looper: ", runtime.NumGoroutine())
time.Sleep(2 * time.Second)
led.ticker.Stop()
fmt.Println("Number of GoRoutines after stopping the ticker: ", runtime.NumGoroutine())
runtime.GC()
fmt.Println("Number of GoRoutines after gc: ", runtime.NumGoroutine())
}
===
Golang playground URL: https://play.golang.org/p/1as5QN1r2c
Gist URL: https://gist.github.com/psankar/8af76ba183b0203ec141bca8156f5955
I will explain roughly what the code is doing.
There is a LED struct which has a Ticker and a state variable. While creating an instance of the led struct, we initialise the state and the Ticker. There is a looper function will toggle the state, whenever the Ticker fires an event.
Now when the program is launched, there will be one goroutine (the initial main thread). After we call looper in a goroutine, the goroutineCount will be 2. Now, comes the tricky part. We stop the Ticker, after a particular amount of time. We even call the gc.
It was observed by Praveen that this piece of code was leaking go routines and the number of go routines was never going down, inspite of the Ticker getting stopped.
The reason why the leakage is happening is because, the "range" loop is never exiting. If the range loop was on a channel, you could "close" it. The ticker.C channel however is a receive only channel and you cannot close it.
How do we fix this, so that none of the goroutines are leaking ? If you have watched the talks, golang concurrency patterns by Rob Pike and Advanced golang concurrency patterns by Sameer Ajmani, then you will realise that it is quite easy to add another parameter to the looper function, which could just exit the loop. So the updated code will be:
===
type LED struct {
state bool
ticker *time.Ticker
}
func toggle(led *LED) {
led.state = !led.state
}
func looper(led *LED) {
for range led.ticker.C {
toggle(led)
}
}
func looper2(led *LED, q chan bool) {
for {
select {
case <-led.ticker.C:
toggle(led)
case <-q:
fmt.Println("Exiting the goroutine")
return
}
}
}
func main() {
fmt.Println("Initial number of GoRoutines: ", runtime.NumGoroutine())
led := &LED{state: true, ticker: time.NewTicker(time.Millisecond * 500)}
q := make(chan bool)
go looper2(led, q)
// go looper(led)
fmt.Println("Number of GoRoutines after a call to looper: ", runtime.NumGoroutine())
time.Sleep(2 * time.Second)
led.ticker.Stop()
fmt.Println("Number of GoRoutines after stopping the ticker: ", runtime.NumGoroutine())
q <- true
fmt.Println("Number of GoRoutines after sending a message on the quit channel: ", runtime.NumGoroutine())
}
===
Playground URL: https://play.golang.org/p/NlWbyHLHvA
Gist URL: https://gist.github.com/psankar/4e5b2e563038ce3e9c17eb208c76168a
Let me know if you have any comments.
Exploring Rust's standard library: system calls and errors
In this post I'll show you the code path that Rust takes inside its
standard library when you open a file. I wanted to learn how Rust
handles system calls and errno, and all the little subtleties of the
POSIX API. This is what I learned!
The C side of things
When you open a file, or create a socket, or do anything else that
returns an object that can be accessed like a file, you get a file
descriptor in the form of an int.
/* All of these return a int with a file descriptor, or
 * -1 in case of error.
 */
int open(const char *pathname, int flags, ...);
int socket(int domain, int type, int protocol);
You get a nonnegative integer in case of success, or -1 in case of an
error. If there's an error, you look at errno, which gives you an
integer error code.
int fd;

retry_open:
fd = open ("/foo/bar/baz.txt", 0);
if (fd == -1) {
    if (errno == ENOENT) {
        /* File doesn't exist */
    } else if (errno == ...) [
        ...
    } else if (errno == EINTR) {
        goto retry_open; /* interrupted system call; let's retry */
    }
}
Many system calls can return EINTR, which means "interrupted system
call", which means that something interrupted the kernel while it
was doing your system call and it returned control to userspace, with
the syscall unfinished. For example, your process may have received a
Unix signal (e.g. you send it SIGSTOP by pressing Ctrl-Z on a
terminal, or you resized the terminal and your process got a
SIGWINCH). Most of the time EINTR means simply that you must
retry the operation: if you Control-Z a program to suspend it, and
then fg to continue it again; and if the program was in the middle
of open()ing a file, you would expect it to continue at that exact
point and to actually open the file. Software that doesn't check for
EINTR can fail in very subtle ways!
Once you have an open file descriptor, you can read from it:
ssize_t
read_five_bytes (int fd, void *buf)
{
    ssize_t result;

    retry:
    result = read (fd, buf, 5);
    if (result == -1) {
        if (errno == EINTR) {
            goto retry;
        } else {
            return -1; /* the caller should cherk errno */
        }
    } else {
        return result; /* success */
    }
}
... and one has to remember that if read() returns 0, it means we
were at the end-of-file; if it returns less than the number of bytes
requested it means we were close to the end of file; if this is a
nonblocking socket and it returns EWOULDBLOCK or EAGAIN then one
must decide to retry the operation or actually wait and try again
later.
There is a lot of buggy software written in C that tries to use the POSIX API directly, and gets these subtleties wrong. Most programs written in high-level languages use the I/O facilities provided by their language, which hopefully make things easier.
I/O in Rust
Rust makes error handling convenient and safe. If you decide to
ignore an error, the code looks like it is ignoring the error
(e.g. you can grep for unwrap() and find lazy code). The
code actually looks better if it doesn't ignore the error and
properly propagates it upstream (e.g. you can use the ? shortcut to
propagate errors to the calling function).
I keep recommending this article on error models to people; it discusses POSIX-like error codes vs. exceptions vs. more modern approaches like Haskell's and Rust's - definitely worth studying over a few of days (also, see Miguel's valiant effort to move C# I/O away from exceptions for I/O errors).
So, what happens when one opens a file in Rust, from the toplevel API down to the system calls? Let's go down the rabbit hole.
You can open a file like this:
use std::fs::File;

fn main () {
    let f = File::open ("foo.txt");
    ...
}
This does not give you a raw file descriptor; it gives you an
io::Result<fs::File, io::Error>, which you must pick apart to see if
you actually got back a File that you can operate on, or an error.
Let's look at the implementation of File::open() and File::create().
impl File {
    pub fn open<P: AsRef<Path>>(path: P) -> io::Result<File> {
        OpenOptions::new().read(true).open(path.as_ref())
    }

    pub fn create<P: AsRef<Path>>(path: P) -> io::Result<File> {
        OpenOptions::new().write(true).create(true).truncate(true).open(path.as_ref())
    }
    ...
}
Here, OpenOptions is an auxiliary struct that implements a "builder"
pattern. Instead of passing bitflags for the various
O_CREATE/O_APPEND/etc. flags from the open(2) system call, one
builds a struct with the desired options, and finally calls .open()
on it.
So, let's look at the implementation of OpenOptions.open():
    pub fn open<P: AsRef<Path>>(&self, path: P) -> io::Result<File> {
        self._open(path.as_ref())
    }

    fn _open(&self, path: &Path) -> io::Result<File> {
        let inner = fs_imp::File::open(path, &self.0)?;
        Ok(File { inner: inner })
    }
See that fs_imp::File::open()? That's what we want: it's the
platform-specific wrapper for opening files. Let's look
at its implementation for Unix:
    pub fn open(path: &Path, opts: &OpenOptions) -> io::Result<File> {
        let path = cstr(path)?;
        File::open_c(&path, opts)
    }
The first line, let path = cstr(path)? tries to convert a Path
into a nul-terminated C string. The second line calls the following:
    pub fn open_c(path: &CStr, opts: &OpenOptions) -> io::Result<File> {
        let flags = libc::O_CLOEXEC |
                    opts.get_access_mode()? |
                    opts.get_creation_mode()? |
                    (opts.custom_flags as c_int & !libc::O_ACCMODE);
        let fd = cvt_r(|| unsafe {
            open64(path.as_ptr(), flags, opts.mode as c_int)
        })?;
        let fd = FileDesc::new(fd);

        ...

        Ok(File(fd))
    }
Here, let flags = ... converts the OpenOptions we had in the
beginning to an int with bit flags.
Then, it does let fd = cvt_r (LAMBDA), and that lambda function
calls the actual open64() from libc (a Rust wrapper for the system's
libc): it returns a file descriptor, or -1 on error. Why is this
done in a lambda? Let's look at cvt_r():
pub fn cvt_r<T, F>(mut f: F) -> io::Result<T>
    where T: IsMinusOne,
          F: FnMut() -> T
{
    loop {
        match cvt(f()) {
            Err(ref e) if e.kind() == ErrorKind::Interrupted => {}
            other => return other,
        }
    }
}
Okay! Here f is the lambda that calls open64(); cvt_r() calls
it in a loop and translates the POSIX-like result into something
friendly to Rust. This loop is where it handles EINTR, which gets
translated into ErrorKind::Interrupted. I suppose cvt_r() stands
for convert_retry()? Let's look at
the implementation of cvt(), which fetches the error code:
pub fn cvt<T: IsMinusOne>(t: T) -> io::Result<T> {
    if t.is_minus_one() {
        Err(io::Error::last_os_error())
    } else {
        Ok(t)
    }
}
(The IsMinusOne shenanigans are just a Rust-ism to help convert
multiple integer types without a lot of as casts.)
The above means, if the POSIX-like result was -1, return an Err() from
the last error returned by the operating system. That should surely
be errno internally, correct? Let's look at
the implementation for io::Error::last_os_error():
    pub fn last_os_error() -> Error {
        Error::from_raw_os_error(sys::os::errno() as i32)
    }
We don't need to look at Error::from_raw_os_error(); it's just a
conversion function from an errno value into a Rust enum value.
However, let's look at sys::os::errno():
pub fn errno() -> i32 {
    unsafe {
        (*errno_location()) as i32
    }
}
Here, errno_location() is an extern function defined in GNU libc
(or whatever C library your Unix uses). It returns a pointer to the
actual int which is the errno thread-local variable. Since non-C
code can't use libc's global variables directly, there needs to be a
way to get their addresses via function calls - that's what
errno_location() is for.
And on Windows?
Remember the internal File.open()? This is what it looks
like on Windows:
    pub fn open(path: &Path, opts: &OpenOptions) -> io::Result<File> {
        let path = to_u16s(path)?;
        let handle = unsafe {
            c::CreateFileW(path.as_ptr(),
                           opts.get_access_mode()?,
                           opts.share_mode,
                           opts.security_attributes as *mut _,
                           opts.get_creation_mode()?,
                           opts.get_flags_and_attributes(),
                           ptr::null_mut())
        };
        if handle == c::INVALID_HANDLE_VALUE {
            Err(Error::last_os_error())
        } else {
            Ok(File { handle: Handle::new(handle) })
        }
    }
CreateFileW() is the Windows API function to open files. The
conversion of error codes inside Error::last_os_error() happens
analogously - it calls GetLastError() from the Windows API and
converts it.
Can we not call C libraries?
The Rust/Unix code above depends on the system's libc for open() and
errno, which are entirely C constructs. Libc is what actually does
the system calls. There are efforts to make the Rust standard library
not use libc and use syscalls directly.
As an example, you can look at the Rust standard library for Redox. Redox is a new operating system kernel entirely written in Rust. Fun times!
Update: If you want to see what a C-less libstd would look like, take a look at steed, an effort to reimplement Rust's libstd without C dependencies.
Conclusion
Rust is very meticulous about error handling, but it succeeds in
making it pleasant to read. I/O functions give you back an
io::Result<>, which you piece apart to see if it succeeded or got an
error.
Internally, and for each platform it supports, the Rust standard
library translates errno from libc into an io::ErrorKind Rust
enum. The standard library also automatically handles Unix-isms like
retrying operations on EINTR.
I've been enjoying reading the Rust standard library code: it
has taught me many Rust-isms, and it's nice to see how the
hairy/historical libc constructs are translated into clean Rust
idioms. I hope this little trip down the rabbit hole for the
open(2) system call lets you look in other interesting places, too.