Member
 baltolkien

Result of the Modernizing AutoYaST initiative
In April, we announced the Modernizing AutoYaST initiative. The idea was not to rewrite AutoYaST but just introduce a few new features, remove some limitations and improve the code quality.
Although they were not set in stone, we had some ideas about what changes we wanted to introduce. However, as soon as we started to work, it became clear that we needed to adapt our roadmap. So if you compare our initial announcement with the result, you can spot many differences.
This article describes the most relevant changes. If you want to try any of these features, they are already available in openSUSE Tumbleweed.
Reducing profiles size
When AutoYaST generates a profile from an existing system, it includes a lot of information to reproduce the installation. As a consequence, those profiles are rather long, which makes working with them quite annoying.
However, it is not always clear when it is safe to omit some information from the profile without compromising the final result. To address this problem, we decided to introduce the concept of target. Thus, when generating a profile, you can ask AutoYaST to generate a more compact profile.
# yast2 clone_system modules target=compact filename=autoinst-compact.xml
In my current machine, the size of the profile is reduced from 2201 lines to just 834. But which information is omitted? Let’s enumerate a few items:
- System users and groups.
- Not modified firewall zones.
- System services which preset has not been changed.
- Printer settings if the
cupsservice is disabled.
Note that not all YaST modules implement support for this flag. Actually, in some cases, it does not make any sense.
Making easier to write dynamic profiles
When dealing with the installation of multiple systems, it might be useful to use a single profile that adapts to the system being installed at runtime. AutoYaST already offered two mechanisms to implement this behavior: rules and classes and pre-install scripts.
However, we though that it might be easier if you could embed Ruby (ERB) code in your profiles. The idea is to provide a set of helper functions that you can use to inspect the system and adjust the profile by setting values, adding or skipping sections, etc. It sounds cool, right? Let’s see a simple example.
The code below finds the largest disk by sorting them size and sets the value of the device
element.
<partitioning t="list">
  <drive>
    <% disk = disks.sort_by { |d| d[:size] }.last %> <!-- find the largest disk -->
    <device><%= disk[:device] %></device> <!-- print the disk device name -->
    <initialize t="boolean">true</initialize>
    <use>all</use>
  </drive>
</partitioning>
Of course, apart from a set of helpers (disks, network_cards, os_release or hardware), you
have the power of Ruby in your fingertips. What about retrieving a whole section from a remote
location? At some extent, it could replace the classes and rules feature.
<bootloader>
  <% require "open-uri" %>
  <%= URI.open("http://192.168.1.1/profiles/bootloader-common.xml").read %>
</bootloader>
Unfortunately, the documentation of this feature is still a work in progress. However, we expect to have it ready in the upcoming weeks.
Improved scripting support
Apart from introducing support for ERB, as described in the previous section, we improved script handling. Until now, Shell, Perl and Python were the only supported scripting languages. We removed this limitation and now you can use any interpreter available at installation time. Moreover, it is possible to pass custom options to the interpreter.
<intepreter>/usr/bin/bash -x</interpreter>
Additionally, we fixed a few issues and extended the error handling to inform the user when the script did not run successfully.
Validating the profile
Building and tweaking your profile can be a time-consuming task. AutoYaST offers XML-based validation, but the sort of errors you can detect is rather limited.
To make your life easier, we introduced these new features to leverage profile validation:
- Automatic profile validation at runtime.
- A new
check-profilecommand to detect errors without running the installer.
When AutoYaST fetches the profile, it automatically performs the XML-based validation, reporting any
error found. It works even if you are using features like Rules and classes or Dynamic profiles.
However, it can be easily disabled by setting the YAST_SKIP_XML_VALIDATION parameter to 1 when
booting the installer.
Regarding the check-profile, it basically uses part of the code that runs during
AutoYaST initialization. It includes:
- Profile fetching (even from a remote location).
- XML-based validation.
- Support for dynamic profiles: rules and classes, ERB and pre-installation scripts (optional).
- Optionally, detection of problems during profile import.
Needlessly to say that you should run this command with caution. Bear in mind that ERB and pre-installation scripts can run any arbitrary code. In fact, we are working with our security experts to make this command safer. See bsc#1177123 for further details.
Reducing the second stage
Unlike a normal installation, AutoYaST still uses two phases, which are known as stages. The first stage is responsible for most of the installation tasks: partitioning, registration, software installation, network configuration, etc. Depending on the content of the profile, the second stage comes into play after the first reboot. It takes care of additional configuration processes, like setting the firewall rules, enabling/disabling services, etc.
To reduce the need for a second stage, we moved the processing of several sections to the first
stage. At this point, these sections are processed during this stage: bootloader,
configuration_management, files, firewall, host, kdump, keyboard, language,
networking, partitioning, runlevel, scripts (except post-scripts and init-scripts, which
are processed during the second stage), security, services-manager, software, ssh_import,
suse_register, timezone and users. Thus if your profile does not contain any other section,
you can happily disable the second stage.
<general>
  <mode>
    <second_stage t="boolean">false</second_stage>
  </mode>
 </general>
A better UI to define the partitioning section
The user interface offered by AutoYaST to define the partitioning section was confusing, buggy and rather limited. Therefore we took the chance to, basically, rewrite the whole thing.

It is still a work in progress, but it is already much better than the old one. For instance, in addition to disks and LVM, it supports defining sections for RAID, bcache and multi-device Btrfs file systems.
It should be noted that these changes are already available in openSUSE 15.2 and SUSE Linux Enterprise 15 SP2, so you do not need to wait until 15.3 or SP3 to enjoy them.
Conclusion
New features and bug fixes are the most visible changes. However, as part of this process, we refactored a lot of code, improved code coverage, extended the documentation, etc. In general, we feel that we improved AutoYaST quality in a sensible way. And we hope you have that impression too in the future.

Podcast 07×03 Software libre y KDE en entornos profesionales: abogacia
Bienvenidos al Podcast 07×03 Software libre y KDE en entornos profesionales: abogacía donde estudiamos si es posible el uso de proyectos libre en esta profesión.
Podcast 07×03 Software libre y KDE en entornos profesionales: abogacía
Tercer podcast de la temporada con el que se cierra el año y en el que tenemos como invitadas a Marelisa Blanco, autora de un cómic sobre licencias de software, «La jungla del software» y abogada en Nolegaltech y María Cerviño, experta en contratos y en dar soluciones creativas, también de Nolegaltech.

Con este podcast empezamos esta temporada una serie sobre el uso de software libre en los entornos profesionales, en los oficios y profesiones. Os pedimos colaboración para localizar a profesionales no relacionados con la informática que conozcáis que estén usando software libre y Gnu/Linux como su entorno principal de trabajo: desde electricistas hasta carpinteros pasando por ingenieros, gestorías, veterinarios…
Otros integrantes del podcast fueron
- Rubén Gómez: miembro de KDE España, de HackLab Almería y de Document Foundation en la labor de presentador.
- Mari Carmen, aka Maika, miembro de KDE España que hizo su presencia inicialmente pero que tuvo problemas técnicos y tuvo que dejar el podcast.
- Baltasar Ortega (un servidor): editor de KDE Blog, secretario de KDE España, miembro de GNU/Linux València y de KDE e.V, que hizo las funciones de presentador de noticias y de presentar información adicional visual. No os perdáis el vídeo que creo que vale la pena, aunque seguro que hay coasa a mejorar.
- Jorge Lama: Diseñador sonoro/productor de podcasting: Coruña Dixital https://spoti.fi/34vr6Ve Bricolabs Podcast http://bit.ly/2KhYBnW NOlegaltech Radio http://goo.gl/GZ2gT3 y, ahora, productor del podcast de KDE España.
Y no os entretengo más, os dejo con el vídeo que dura su hora y 20 minuto, uno de los podcast más cortos de los últimos tiempos.
Espero que os haya gustado, si es así ya sabéis: “Manita arriba“, compartid y no olvidéis visitar y suscribiros al canal de Youtube de KDE España.
Como siempre, esperamos vuestros comentarios que os aseguro que son muy valiosos para los desarrolladores, aunque sean críticas constructivas (las otras nunca son buenas para nadie). Así mismo, también nos gustaría saber los temas sobre los que gustaría que hablásemos en los próximos podcast.

Curso de Vim: Sincronizar el “scroll” en dos ventanas del editor #Vim
Veamos cómo hacer que dos (o más) ventanas se sincronicen cuando hagamos “scroll” en una de ellas.

El otro día mientras seguí mi traducción del libro sobre Vim que estoy realizando, hice una división de la ventana y abrí el original en inglés para comparar unas modificaciones.
Y en cierto momento pensé, estaría bien que mientras desplazo el texto de mi traducción haciendo “scroll” también estubiera sincronizada la otra ventana y se desplazara para comparar todo el texto sin necesidad de desplazarme y hacer “scroll” también en esa ventana.
¡Y dicho y hecho, el editor Vim ofrece esa posibilidad! No para de sorprenderme esta gran herramienta para editar textos de manera eficiente y rápida. Veamos cómo.
Este artículo es una nueva entrega del curso “improVIMsado” que desde hace meses vengo publicando en mi blog sobre el editor Vim y que puedes seguir en estos enlaces:
- https://victorhckinthefreeworld.com/tag/vim/
- https://victorhck.gitlab.io/comandos_vim/articulos.html
Veamos el escenario principal. Tengo el editor con la vista dividida en dos de manera vertical (me gusta más de esa manera) editando/traduciendo en una ventana un texto y en la otra tengo el original.
Sitúo el cursor en ambas en la primera línea del archivo con el comandos gg y ahora hago que se sincronicen el desplazamiento de texto ejecutando en ambas ventanas el comando:
:set scrollbind
O de manera reducida también puedes ejecutar:
:set scb
Ahora cuando me desplace en una ventana, en la otra el texto se desplazará automáticamente de manera similar.
Por supuesto, no es necesario que esté el cursor en la primera línea, simplemente en mi caso lo estaba revisando desde la primera línea y quería que ambos se sincronizasen desde esa línea.
Y también decir, que podemos tener dos o más divisiones en la ventana y ejecutar en todas ellas el comando, y en todas las ventanas que lo ejecutamos, estarán sincronizadas.
Para dejar que estén sincronizadas, ejecutaremos el mismo comando (el largo o el corto) pero ahora añadiendo al final del comando el símbolo !
:set scb!
Si quieres más información sobre este comando, ejecuta en Vim la ayuda para leer más al respecto:
:help scrollbind

openSUSE en Raspberry Pi 4
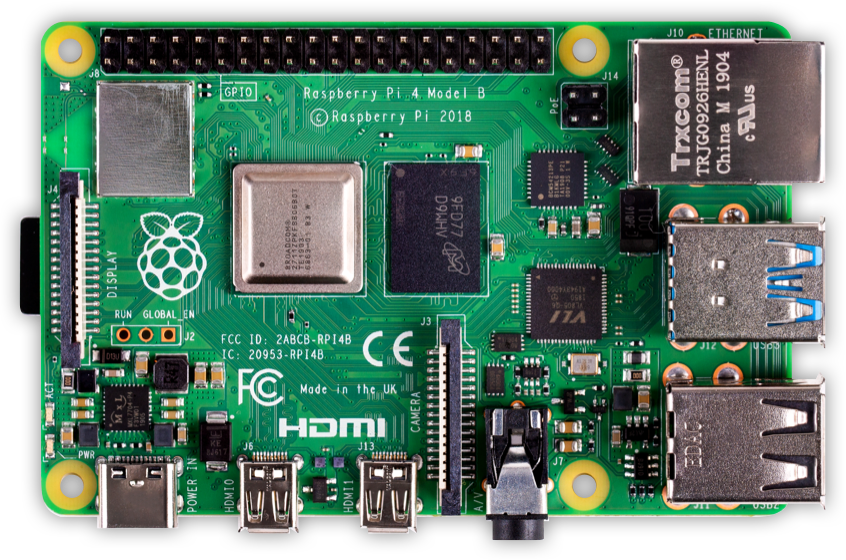
La Raspberry Pi 4 es una computadora del tamaño de una tarjeta de crédito que se conecta a una pantalla de tv y un teclado. Es una pequeña PC que puede usarse para muchas de las cosas que se realizan en una PC de escritorio, como hojas de cálculo, procesamiento de texto y juegos. También reproduce videos de alta definición.
Datos Técnicos
-
Broadcom BCM2711 SoC
- 4x ARM Cortex-A72 CPU @ 1.5GHz.
- RAM: 1 - 8 GB LPDDR4-2400 SDRAM (dependiedo del modelo)
- Gigabit Ethernet
- WiFi – 2.4 GHz y 5.0 GHz IEEE 802.11ac wireless
- Bluetooth 5.0, BLE
- USB: 2x puertos USB 3.0; 2x puertos USB 2.
- Conector 40-pines
openSUSE en Raspberry Pi 4
Escribir una imagen de disco en una memoria USB o una tarjeta SD
1. Descargamos la imagen que se desea (Leap es estable, Tumbleweed es cambios continuos) desde aquí. Elejimos los escritorios:
JeOS: sistema operativo suficiente: un sistema muy básico, sin escritorio gráfico
E20 - Escritorio Enlightenment
XFCE: Escritorio XFCE
KDE - Escritorio KDE
LXQT - Escritorio LXQT
X11 - Sistema básico X11
| Version:
Tumbleweed
|
|
|
|
|
|
|
|
|
|
|
|
|
|
|
|
|
|
|
|
|
|
|
|
|
|
|
|
|
|
|
|
Imagen JeOS Imagen E20 Imagen XFCE Imagen LXQT Imagen KDE Imagen X11
| Version:
Leap-15.2
|
|
Imagen JeOS Imagen E20 Imagen XFCE Imagen LXQT Imagen KDE Imagen X11
Directorio de descarga general de las imágenes ISO
2. Como root, extraemos la imagen en la tarjeta SD (reemplazamos sdX con el nombre del dispositivo de nuestra tarjeta SD).
ADVERTENCIA: se perderán todos los datos anteriores de la tarjeta SD. ¡Comprobaos primero si el dispositivo que se ha seleccionado es realmente nuestra tarjeta SD!
xzcat [image].raw.xz | dd bs=4M of=/dev/sdX iflag=fullblock oflag=direct status=progress; sync
3. Insertamos la tarjeta SD con la imagen de openSUSE en la placa (Raspberry Pi).
4. Conectamos la placa a la PC a través del puerto serie (opcional, pero útil para la depuración; se necesita un cable serie USB-TTL).
5. Conectamos la placa al monitor (a través de DVI / HDMI).
6. Encendemos la Raspberry Pi.
7. Seguimos los primeros pasos del arranque.
8. La Ethernet está configurado para solicitar una IP a través de DHCP, verificamos si el servidor DHCP está asignando la IP a la Raspberry Pi.
9. ¡Listo. Diviértete mucho...!
El inicio de sesión predeterminado es usuario: root, contraseña: linux. Esta configuración funciona en la consola serial a través de ssh y en el entorno gráficode usuario (GUI).
小ネタ:transactional serverでbtrfs balance
諸事情で、MicroOSのルートにbtrfsの機能でディスクを追加したのですが、balasceを実行しようとすると「read onlyだよ」と警告が。
ユーザ会slackに投げてみた所、武山さんから「transactional-update shellの中ならいけるのでは?」との助言を頂きました。
結論
成功
コマンド
transactional-update shell
transactional-updateそのもののアップデートが行われた後、独自のシェルに移行しました。
transactional update #
この状態で書き込み可能になります。書き込み後、シェルを抜けてrebootすれば反映されるしくみですね。
btrfs balance /
前後の状態を撮り損ねてしまったのですが、無事にbalanceされてました。
transactional-updateの真価はまだ味わえてないので、ロールバック等含め、近いうちにまとめて検証してみたいですね。
そもそも、transactional-update shellが一体何をどうしているのかも追えていない・・・
openSUSE Leap 15.3 と Closing The Leap Gap について
この記事は openSUSE Advent Calendar の 22 日目です。
今日は openSUSE Leap 15.3 に向けて openSUSE Leap を SUSE Linux Enterprise にさらに近づける取り組み Closing The Leap Gap について紹介します。
openSUSE Leap のおさらい
openSUSE Leap は openSUSE 13.2 の後継のディストリビューションで、2015年に最初のバージョンの 42.1 がリリースされました。openSUSE Leap では、それまでの openSUSE よりも長期間のサポートと安定性を目指すことになりました。
これを実現するための手段として、openSUSE Leap と SUSE Linux Enterprise (SLE) の間でコアパッケージを共通化することになりました。これにより、パッケージに対して何らかの修正をしなければいけなくなったときも、SLE の修正を取り込むだけでコアパッケージをほぼ保守することができるようになりました。
openSUSE Leap は SLE のクローンではありません。コミュニティディストリビューションとして魅力的なものとなるよう、SLE 由来のコアパッケージに加え、openSUSE Tumbleweed ベースの多数のパッケージが含まれています。また、すべての SLE のパッケージが含まれていたり、完全な互換性を目指しているわけではありません。この点では多くの RedHat Enterprise Linux 派生ディストリビューションとは異なります。
Closing the Leap Gap
openSUSE Leap 15.2 まではコアパッケージのソースコードは共有していましたが、バイナリレベルでは違いがありました。その原因は、ビルドオプションの違いで、多くの場合は openSUSE のほうが有効化される機能が多い傾向があります。
このバイナリレベルでの微妙な違いが品質保証やメンテナンス上の二度手間になっていました。また、SLE では、openSUSE Leap のパッケージを SLE で使えるようにする Backport リポジトリがありますが、コアパッケージが微妙に違うことで openSUSE Leap のパッケージをそのまま使えず、少なくとも再ビルド、場合によっては手直しが必要でした。サードパーティーのパッケージについても、openSUSE Leap と SLE で同一のビルドを利用できない場合がありました。
そこで、この微妙な違いを無くす、Closing the Leap Gap が始動しました。このプロジェクトでは SLE から openSUSE にビルド済みのバイナリパッケージを提供し、SLE と openSUSE Leap のコアパッケージをバイナリレベルで同一にすることを目指しています。同一にするために、一部のでは openSUSE の独自機能を SLE に取り込んだり、openSUSE の独自部分をサブパッケージに分離したりしました。
https://en.opensuse.org/Portal:Leap/FAQ/ClosingTheLeapGap
この活動の成果として、openSUSE Leap 15.2 をベースに本活動の成果を反映したプロトタイプ、 openSUSE Jump (あるいは openSUSE 15.2.1) が開発されました。
なお、一部のパッケージは技術上の問題で同一にできない見込みで、その差分については wiki などでドキュメント化されることになりそうです。
https://en.opensuse.org/Portal:15.3/Features:Identicality
15.3 に向けて
openSUSE Leap 15.3 は Closing the Leap Gap の成果が反映されたディストリビューションとしてリリースされることになっています。
開発インフラの調整も進められており、SLE のバイナリパッケージと openSUSE のパッケージを使ってビルドできるようになっています。
これまで同様、またそれ以上に、コミュニティ開発者が openSUSE Leap と SLE に貢献できるよう、openSUSE のコミュニティ開発者が、SUSE の JIRA を使って今後の開発についてリクエストを出したり、議論したりすることができるようになる予定です。
Digital Clock BeClock style – Plasmoides de KDE (164)
Hacía tiempo que no hablaba de relojes en el blog, y eso que tenía esta maravilla entre mis relojes favoritos pero por alguna oscura razón se me había pasado compartirlo en el blog (o si lo he hecho no lo he encontrado entre los miles de artículos del blog). Se trata de Digital Clock BeClock Style, el plasmoide de KDE número de 164 de la serie, un reloj que es todo belleza y elegancia.
Digital Clock BeClock style – Plasmoides de KDE (164)
Hoy os presento Digital Clock BeClock style una creación de The Vlad Soft que nos proporciona un simple reloj digital pero rodeado de un par de líneas circulares, uno para las horas y otra para los minutos, de tal forma que podemos leer la hora de las dos forma de un simple golpe de vista.
Por otra parte, este reloj ofrece un vistoso efecto óptico den forma de flash cuando se llega a una hora en punto.

Ss opciones de configuración son simples pero bastante llamativas :
- Modificar los colores del anillo
- Desactivar/Habilitar el flash
- Desactivar/Habilitar el efecto de gradiente
- Añade una imagen de fondo de tu distribución (o cualquier imagen que quieras, incluso imágenes remotas)
Y como siempre digo, si os gusta el plasmoide podéis “pagarlo” de muchas formas en la nueva página de KDE Store, que estoy seguro que el desarrollador lo agradecerá: puntúale positivamente, hazle un comentario en la página o realiza una donación. Ayudar al desarrollo del Software Libre también se hace simplemente dando las gracias, ayuda mucho más de lo que os podéis imaginar, recordad la campaña I love Free Software Day 2017 de la Free Software Foundation donde se nos recordaba esta forma tan sencilla de colaborar con el gran proyecto del Software Libre y que en el blog dedicamos un artículo.
Más información: KDE Store
¿Qué son los plasmoides?
Para los no iniciados en el blog, quizás la palabra plasmoide le suene un poco rara pero no es mas que el nombre que reciben los widgets para el escritorio Plasma de KDE.
En otras palabras, los plasmoides no son más que pequeñas aplicaciones que puestas sobre el escritorio o sobre una de las barras de tareas del mismo aumentan las funcionalidades del mismo o simplemente lo decoran.
Las novedades variadas de KDE de diciembre de 2020
La pasada actualización de las aplicaciones de KDE de diciembre nos ofreció interesantes nuevas funcionalidades. En el artículo del anuncio ya hablamos largo y tendido de las novedades de Kontact, también hemos hablado de Dolphin, el explorador de archivos, y de Konsole y Spectacle. Además ya hemos hablado de las mejoras en Konversation y las de KDE Connect, quedando para el final el cocktail de las novedades variadas de KDE de de diciembre de 2020. Esto no para, esto es KDE!
Las novedades variadas de KDE de diciembre de 2020
Finalizo la serie de artículos sobre la última remesa de actualizaciones de algunas de las aplicaciones de la Comunidad KDE con una macedonia de las mismas, que no son pocos y sí muy interesantes:
- Elisa, un reproductor de música compacto, nos permite ahora cambiar el esquema de color de la aplicación independientemente del esquema de color global del sistema. Ahora también le permite elegir la vista a mostrar cuando se inicia la aplicación.
- Ark, la utilidad de compresión de KDE, permite ahora usar archivos comprimidos con zstd.
- Gwenview, un visor avanzado de imágenes y videoclips, dispone ahora de una opción para no reproducir los vídeos de forma automática en el modo de navegación.
- Kate es un editor de texto con múltiples funcionalidades. El explorador de archivos de Kate contiene ahora la opción Abrir con en el menú de contexto.
- Filelight muestra de forma visual el espacio que ocupa en el disco cada carpeta y archivo. Filelight contiene ahora una funcionalidad para guardar la vista actual como archivo SVG.

- Los asistentes de Nextcloud y de Owncloud de KDE presumen ahora de un aspecto visual revisado en la página Cuentas con conexión de las Preferencias del sistema.
- KAlarm, un gestor personal de mensajes de alarma, órdenes y planificación de correo electrónico, dispone ahora de la opción de usara el sistema de notificaciones para mostrar mensajes de alarma. También contiene la opción de dar un nombre a las alarmas para que sea más fácil identificarlas.
Y para finalizar el anuncio de la llegada de una aplicación a a Playground, que es donde trabajamos en ellas antes de que estén listas para su lanzamiento, se llama TotalReqall que es un programa para memorizar la Biblia y otras obras que usa la biblioteca Sword.
Más información: KDE