
 Member
 DimStar
openSUSE Tumbleweed – Review of the week 2022/39
Dear Tumbleweed users and hackers,
This week’s been a little different from Tumbleweed as our regular release wrangler, Dominique, has been sick. Therefore I’ve stepped in and picked things up without our usual handovers which made things a little challenging, but I’m proud to be able to say we still released 5 snapshots in the last 7 days, including some pretty big changes.
The 5 snapshots (0922..0929 excluding 0924 and 0927) released during this week brought you these larger changes among many many smaller ones:
- bind 9.18.7 (Security and minor feature/bug fixes)
- libreoffice 7.4.1.2
- nodejs 18 as the default
- Mesa 22.2.0
- Kernel 5.19.10
- btrfsprogs 5.19.1
- mariadb 10.9.3
- gnome-shell-extensions 43.0
- libqt5 5.15.16
- perl-Mojolicious 9.27
In the next snapshot (0930) we expect the following fun stuff:
- Linux kernel 5.19.12
- Nodejs 18.10
- distrobox 1.4.1
In the staging projects, we currently test submissions like:
- distrobox as the default instead of toolbox for the MicroOS Desktop (Staging:C)
- KDE Plasma 5.26 (5.25.90 staged, Staging:K)
- LLVM 15: breaks all versions of PostgreSQL (Staging:M, almost ready)
- bash 5.2/readline 8.2 (breaks tre and also broke tcsh but fix already with these in Staging:A)
- fmt 9.0: Breaks ceph and zxing-cpp
- gpgme 1.18: breaks LibreOffice
- libxslt 1.1.36: breaks daps
- util-linux 2.38.1: this also brings a massive package layout change, which will probably take some time to settle. It’s part of the distro bootstrap and we have to be careful not to blow it out of proportion

Kmail Message List Tabs

SMB3 UNIX Extensions
One of the primary issues preventing the last few holdouts from migrating away from SMB1 is a lack of Posix/UNIX extensions in SMB2+. SMB1 is definitely going away though in the near future.
To compensate, the community has been hard at work creating a new UNIX extension standard for SMB3. These have been in the works since as early as 2010, but have recently seen some renewed interest in completion. The Linux ksmbd server and cifs client both support SMB3 UNIX extensions. Several third party servers also offer support. Support from Samba server is nearing completion.
A critical part of implementing a new standard is documenting that standard. I, along with several other members of the Samba team, have collaborated on an open standard (not GPL), which fits neatly in with the other SMB protocol documents. The project is currently hosted on codeberg. The license is intentionally friendly to both opensource and closed source.
The details of the documentation are only now being written down, but have been hashed out over the past 12 years in various iterations. A preliminary version of the specification is available below.
If you have comments or suggested edits, please join the discussion on the samba-technical mailing list.
syslog-ng 101: how to get started with learning syslog-ng?
How to get started with syslog-ng? There are two main resources: the syslog-ng documentation and the syslog-ng blogs. You should learn the concepts and basics from the documentation. The blogs document use cases and you can use the docs as a reference.
syslog-ng logo
Read the rest of my blog at: https://www.syslog-ng.com/community/b/blog/posts/syslog-ng-101-how-to-get-started-with-learning-syslog-ng
Multiple stage servers in open build service
The open build service publisher has a configuration variable in BSConfig.pm, where you can define a rsync server to publish the built repos to.
Unfortunately, the documentation apart from the actual code (in src/backend/bs_publish function sync_to_stage) seems scarce, so let's document one non-standard usage here.
"Standard" (IMO) usage, one rsync staging server:
our $stageserver = 'rsync://my-rsync/obs-repos-module';
But now, for a transition phase, I need multiple rsync servers that are all synced to. The format for this is a perl array variable reference that contains pairs of "project name regex, array of sync servers". This also allows to sync different repositories to different rsync servers for example.
The simplest use of this is "sync all repos to multiple rsync servers" and is configured like this:
our $stageserver = ['.*', ['rsync://rsync1/module1', 'rsync://rsync2/module2', 'rsync://rsync3/module3']];
With this configuration, bs_publish will send all repos to the three mentioned rsync URLs in turn.

Gitea Joins the SCM/CI Party!

ALP prototype 'Les Droites' is to be expected later this week.
All of the ALP Workgroups are working towards delivering promised September ALP prototype with the codename “Les Droites”. SUSE will continue using a mountain naming theme for all upcoming prototypes, which will be delivered on a three months basis from now.
Adaptable Linux Platform (ALP) is planned, developed, and tested in open so users can simply get images from OBS and see test results in openQA
As far as “Les Droites” goes, users can look forward to a SLE Micro like HostOS with self-healing abilities contributing to our OS-as-a-Service/ZeroTouch story. The Big Idea is that the user focuses on the application rather than the underlying host, which manages, heals, and self-optimizes itself. Both Salt (pre-installed) and Ansible will be available to simplify further management.
Users can look forward to Full Disk Encryption (FDE) with TPM support by default on x86_64. Another part of the deliverables are numerous containerized system components including yast2, podman, k3s, cockpit, Display Manager (GDM), and KVM. All of which users can experiment with, which are simply referred to as Workloads.
A seamless system integration will arrive later and may vary based on the type of workload. An example could be /usr/bin wrapper deployed via rpm, etc. An example of running a ncurses variant of a YaST workload on ALP or in fact any podman-enabled Linux system.
$ podman container runlabel run \
registry.opensuse.org/suse/alp/workloads/tumbleweed_containerfiles/suse/alp/workloads/yast-mgmt-ncurses:latest
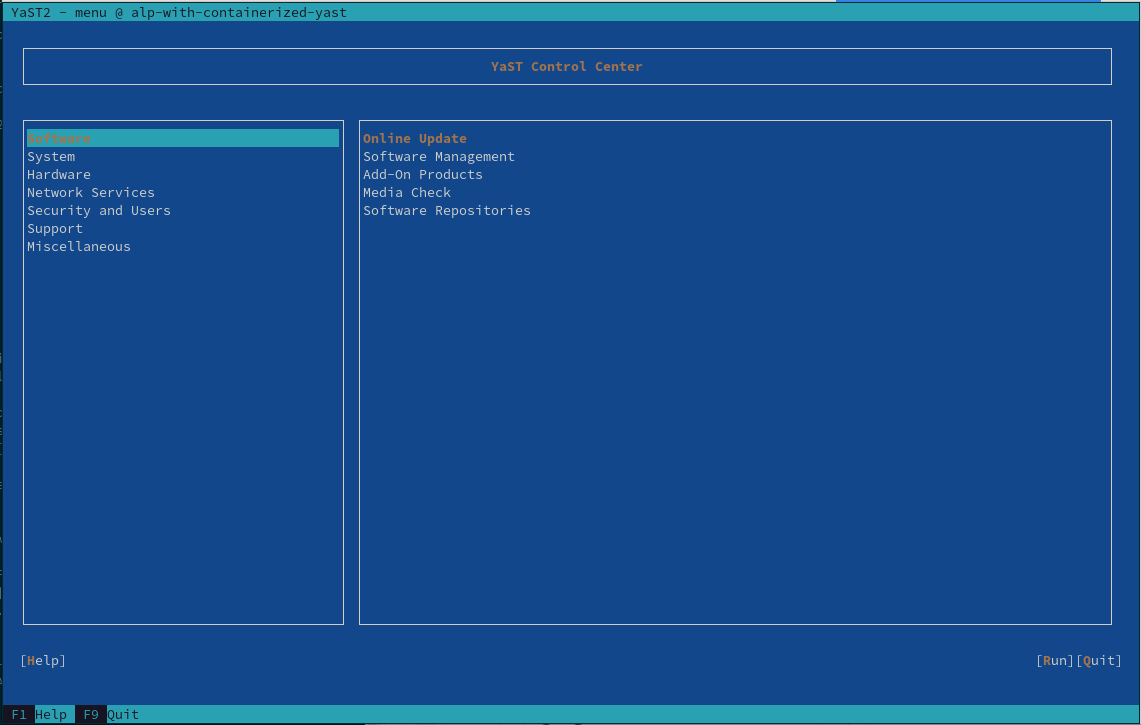
We strongly recommend that users read the following articles for more information about ALP workloads yast-report-2022-7, yast-report-2022-8, and Cockpit_at_ALP wiki.
ALP minimal arch baselevel will be x86_64-2
There is big news brewing! SUSE has reconsidered setting the minimum architecture baseline for ALP from the originally announced x86_64-v3 to x86_64-v2.
SUSE is currently looking into providing support for x86_64-v3 and perhaps even v4 through hwcaps functionality, just as it is currently being handled on other non-intel architectures.
Dimstar already announced that openSUSE Factory will lead the way and set the minimum architecture level for Intel to x86_64-v2 in upcoming weeks.
Those who have older hardware than x86_64-v2 can still install the 32bit Intel variant of openSUSE Tumbleweed. We have you covered!
Original discussion with proposal to change minimal architecture baselevel in Factory can be found here 20220728.
The New Watchlist Came to Stay