
 Member
 cornelius
Pair programming with git
Ruby on openSUSE
How To Fix MacBook Air Keyboard on openSUSE Leap (or Systemd Linux)
One of the problems if you install Linux on your MacBook Air is your Tilde/Backtick keys are not recognized with the output. it will be appearing different symbols. As a Zimbra Administrator, i need backtick symbol for specifying email server host (`zmhostname`).
I have openSUSE Leap 42.3 on my MacBook Air, now i usually use openSUSE rather than My MacOS Sierra. But this problem comes to me and still bothering my jobs.
It turns out …
The problem is very simple. This because https://bugzilla.kernel.org/show_bug.cgi?id=60181#c43
To fix it, Just run this command :
echo 0 > /sys/module/hid_apple/parameters/iso_layout
Very simple right?
It’s Solved, but …
The problem will come to you again if you restart your MacBook Air. So if you use systemV or init. you can place those command on rc.local or boot.after.
But, how if your operating system using Systemd?
I have openSUSE Leap 42.3 on my MacBook Air, now i usually use openSUSE rather than My MacOS Sierra. But this problem comes to me and still bothering my jobs.
Simple, you just need to create a service with that command. create a .service file. For example, i use openSUSE Leap, i create it on /etc/systemd/system/mba-keyboard-fix.service with the following script:
[Unit]
Description=Fix MacBook Air Keyboard

[Service]
Type=oneshot
ExecStart=/bin/bash -c '/usr/bin/echo 0 > /sys/module/hid_apple/parameters/iso_layout'

[Install]
WantedBy=multi-user.target
Or, to simplify it. Just download that file using wget:
cd /etc/systemd/system/
wget -c https://dhenandi.com/repo/mba-keyboard-fix.service
Then start the service and enable it.
systemctl enable mba-keyboard-fix.service
systemctl start mba-keyboard-fix.service
Try to reboot your MacBook Air, if it doesn’t work for you. Just sell your MacBook Air and buy an openSUSE Tuxedo Infinity instead :-P.
The post How To Fix MacBook Air Keyboard on openSUSE Leap (or Systemd Linux) appeared first on dhenandi.com.
Gold Cards
How does your team prioritise work? Who gets to decide what is most important? What would happen if each team member just worked on what they felt like?
I’ve had the opportunity to observe an experiment: over the past 8 years at Unruly, developers have had 20% of their time to work on whatever they want.
This is not exactly like Google’s famed 20% time for what “will most benefit Google” or “120% time”.
Instead, developers genuinely have 20% of their time (typically a day a week) to work on whatever they choose—whatever they deem most important to themselves. There are no rules, other than the company retains ownership of anything produced (which does not preclude open sourcing).
We call 20% time “Gold Cards” after the Connextra practice it’s based upon. Initially we represented the time using yellow coloured cards on our team board.
It’s important to us—if the team fails to take close to 20% of their time on gold cards it will be raised in retrospectives and considered a problem to address.
While it may seem like an expensive practice, it’s an investment in individuals that I’ve seen really pay off, time after time.
Antidote to Prioritisation Systems
If you’re working in a team, you’ll probably have some mechanism for making prioritisation decisions about what is most important to work on next; whether that be a benevolent dictatorship, team consensus, voting, cost of delay, or something else.
However much you like and trust the decision making process in your team, does it always result in the best decisions? Are there times when you thought the team was making the wrong decision and you turned out to be right?

Gold cards allow each individual in the team time to work on things explicitly not prioritised by the team, guilt free.
This can go some way to mitigating flaws in the team’s prioritisation. If you feel strongly enough that a decision is wrong, then you can explore it further on your gold card time. You can build that feature that you think is more important, or you can create a proof-of-concept to demonstrate an approach is viable.
This can reduce the stakes in team prioritisation discussions, taking some of the stress away; you at least have your gold card time to allocate how you see fit.
Here’s some of the ways it’s played out.
Saving Months of Work
I can recall multiple occasions when gold card activities have saved literally team-months of development work.
Avoiding Yak Shaving
One was a classic yak-shaving scenario. Our team discovered that a critical service could not be easily reprovisioned, and to make matters worse, was over capacity.
Fast forward a few weeks and we were no longer just reprovisioning a service, but creating a new base operating system image for all our infrastructure, a new build pipeline for creating it, and attempting to find/build alternatives for components that turned out to be incompatible with this new software stack.
We were a couple of months in, and estimated another couple of months work to complete the migration.
We’d retrospected a few times, we thought we’d fully considered our other options and we were just best off ploughing on through the long, but now well-understood path to completion.
Someone disagreed, and decided to use their gold card to go back and re-visit one of the early options the team thought they’d ruled out.
Within a day they’d demonstrated a solution to the original problem using our original tech stack, without needing most of the yak shaving activities.
Innovative Solutions
I’ve also seen people spotting opportunities in their gold cards that the team had not considered, saving months of work.
We had a need to store a large amount of additional data. We’d estimated a it would take the team some months to build out a new database cluster for the anticipated storage needs.
A gold card used to look for a mechanism for compressing the data, ended up yielding a solution that enabled us to indefinitely store the data, using our existing infrastructure.
Spawning new Products
Gold cards give people space to innovate, time to try new things, wild ideas that might be too early.
Our first mobile-web compatible ad formats came out of a gold card. We had mobile compatible ads considerably before we had enough mobile traffic to make it seem worthwhile.
Someone wanted to spend time working on mobile on their gold card, which resulted in having a product ready to go when mobile use increased, we weren’t playing catch up.
On another occasion a feature we were exploring had a prohibitively large download size for the bandwidth available at the time. A gold card yielded a far more bandwidth-efficient mechanism, contributing to the success of the product.
“How hard can it be?”
It’s easy to underestimate the complexity involved in building new features. “How hard can it be?” is often a dangerous phrase, uttered before discovering just how hard it really is, or embroiling oneself in large amounts of work.
Gold cards make this safe. If it’s hard enough that you can’t achieve it in your gold card, then you’ve only spent a small amount of time, and only your own discretionary time.
Gold cards also make it easy to experiment—you don’t need to convince anyone else that it will work. Sometimes, just sometimes, things actually turn out to be as easy, or even easier, than our hopes.
For a long time we had woeful reporting capabilities on our financial data. The team believed that importing this data to our data warehouse would be a large endeavour, involving redesigning our entire data pipeline.
A couple of developers disagreed, and decided to spend their gold card time working together, attempting to making this data reportable. They ended up coming up with a simple solution, that was compatible with the existing technology, and has withstood the test of time. Huge value unlocked from just one day spent speculatively.
That thing that bothers you
Whether it’s a code smell you want to get rid of, some UX debt that irritates you every time you see it, or the lack of automation in a task you perform regularly; there are always things that irritate us.
We ought to be paying attention to these irritations and addressing them as we notice them, but sometimes the team has deemed something else is more important or urgent.
Gold cards give you an opportunity to fix the things that matter to you. Not only does this help avoid frustration, but sometimes individuals fixing things they find annoying actually produces better outcomes than the wisdom of the crowd.
On one occasion a couple of developers spent their gold card just deleting code. They ended up deleting thousands of unneeded lines of code. Did this cleanup pay off yet? I honestly don’t know, but it may well have done, we have less inventory cost as a result.
Exploring New Tech

When tasked with solving a problem, we have a bias towards tools & technology that we know and understand. This is generally a good thing, exploring every option is often costly and if we pick something new, then the team has to learn it before we become productive.
Sometimes this means we miss out on tech that makes our lives much easier.
People often spend their gold card time playing around with speculative new technologies that they were unfamiliar with.
Much of the tech our teams now rely upon was first investigated and evangelised by someone who tried it out in gold card time; from build systems to monitoring tools, from to databases to test frameworks.
Learning
Tech changes fast; as developers we need to be constantly learning to stay competitive. Sometimes this can present a conflict of interest between the needs of the team to achieve a goal (safer to use known and reliable technology), and your desires to work with new cutting-edge tech.
Gold cards allow you to to prioritise your own learning for at least a day a week. It’s great for you, and it’s great for the team too as it brings in new ideas, techniques, and skills. It’s an investment that increases the skill level of the team over time.
Do you feel like you’d be able to be a better member of the team if you understood the business domain better? What if you knew the programming language you’re working in to a deeper level? If these feel important to you, then gold cards give you dedicated time that you can choose to spend in that way, without needing anyone else’s approval.
Sharing Knowledge
Some people use gold card time to prepare talks they want to give at conferences, or internally at our fortnightly tech-talks. Others write blog posts.
Sharing in this way not only helps others internally, but also gives back to the wider community. It raises people’s individual profiles as excellent developers, and raises the company’s profile as a potential employer.
Furthermore, many find that preparing content in this way improves their own understanding of a topic.
We’re so keen on this that we now give people extra days for writing blog posts.
Remote Working
Many of our XP practices work really well in co-located teams, but we’ve struggled to apply them to remote working. It’s definitely possible to do things like pair and mob-programming remotely, but it can be challenging for teams used to working together in the same space.
We’ve found that gold card time presented an easy opportunity to experiment with remote working—an opportunity to address some of the pain points as we look for ways to introduce more flexibility.
Remote working makes it easier to hire, and helps avoid excluding people who would be unable to join us without this flexibility
Side Projects
Sometimes people choose to work on something completely not work related, like a side project, a game, or a new app. This might not seem immediately valuable to the team, but it’s an opportunity for people to learn in a different context—gaining experience in greenfield development, starting a project from scratch and choosing technologies.
The more diverse our team’s experience & knowledge, the more likely we are to make good decisions in the future. Change is a constant in the industry—we won’t we’ll be working with the tech we’re currently using indefinitely.
Side projects bring some of this learning forward and in-house; we get new perspectives without having to hire new people.
Gold cards allow people to grow without expecting them to spend all their evenings and weekends writing code, encouraging a healthy work/life balance.
Sometimes a change is just what one needs. We spend a lot of our time pair programming; pairing can be intense and tiring. Gold cards give us an opportunity to work on something completely different at least once a week.
Open Source
Most of what we’re working on day to day is not suitable for open sourcing, or would require considerable work to open up.
Gold cards mean we can choose to spend some of our time working on open source software—giving back to the community by working on existing open source code, or working on opening up internal tools.
Hiring & Retention
Having the freedom to spend a day a week working on whatever you want is a nice perk. Offering it helps us hire, and makes Unruly a hard place to leave. The flexibility introduced by gold cards to do the kinds of things outlined above also contribute towards happiness and retention.
Given the costs of recruitment, hiring, onboarding & training, gold cards are worth considering as a benefit even if you didn’t get any of the extra benefits from these anecdotes.
Pitfalls
One trap to avoid is only doing the activities outlined above on gold card days. Many of the activities above should be things the team is doing anyway.
I’ve seen teams start to rely on others—not cleaning up things as a matter of course during their day to day work, because they expect someone will want to do it on their gold card.
I’ve seen teams not set time aside for learning & exploring because they rely on people spending their gold cards on it.
I’ve seen teams ineffectually ploughing ahead with their planned work without stepping back to try to spike some alternative solutions.
These activities should not be restricted to gold cards. Gold cards just give each person the freedom to work on what is most important to them, rather than what’s most important to the team.
There’s also the opposite challenge: new team members may not realise the full range possible uses for gold cards. Gold card use can drift over time to focus more and more on one particular activity, becoming seen as “Learning days” or “Spike days”.
Gold cards seem to be most beneficial when they are used for a wide variety of activities, helping the team notice the benefits of things they hadn’t seen as important.
Gold card time doesn’t always pay off, but it only has to pay off occasionally to be worthwhile.
Picard management tip: Even without game-changing results, experimentation is time well spent.
— Picard Tips (@PicardTips) October 23, 2017
Can we turn it up?
We learn from extreme programming to look for things that are good and turn them up to the max, to get the most value out of them.

If gold cards can bring all these benefits, what would happen if we made them more than 20% time?
Can we give individuals more autonomy without losing the benefits of other things we’ve seen to work well?
What’s the best balance between individual autonomy and the benefits of teams working collaboratively, pair programming, team goals, and stakeholder prioritisation?
We’ve turned things up a little: giving people extra days for conference speaking and blogging, carving out extra time for code dojos, talk preparation, and learning.
I’m sure there’s more we can do to balance the best of individuals working independently, with the benefits of teams.
What have you tried that works well?
2018w03-04: repo_checker devel package comments, announcer re-deployment, CI tweaks, and more
repo_checker devel package comments from multiple target projects
A while back the repo_checker gained the ability to post comments on packages within devel projects for which problems were detected in the target project. Since openSUSE:Factory has a fair number of existing problems, many of which are long-standing, it seemed the maintainers needed to be notified of problems rather than users reporting them in the opensuse-factory mailing list or similar. One limitation of the original implementation was that only one comment could exist per devel package. This workflow is standard among the ReviewBots which only post one comment per entity, but it would be preferred to also post reports for openSUSE:Leap:15.0 since the issues may be different.
A bot_name_suffix was introduced to allow for differentiation between the comments based on the target project for which they represent. With this new ability devel package comments were enabled for Leap 15.0 in addition to Factory. An example of two comments on the same package, science/avogadro, can be seen below.
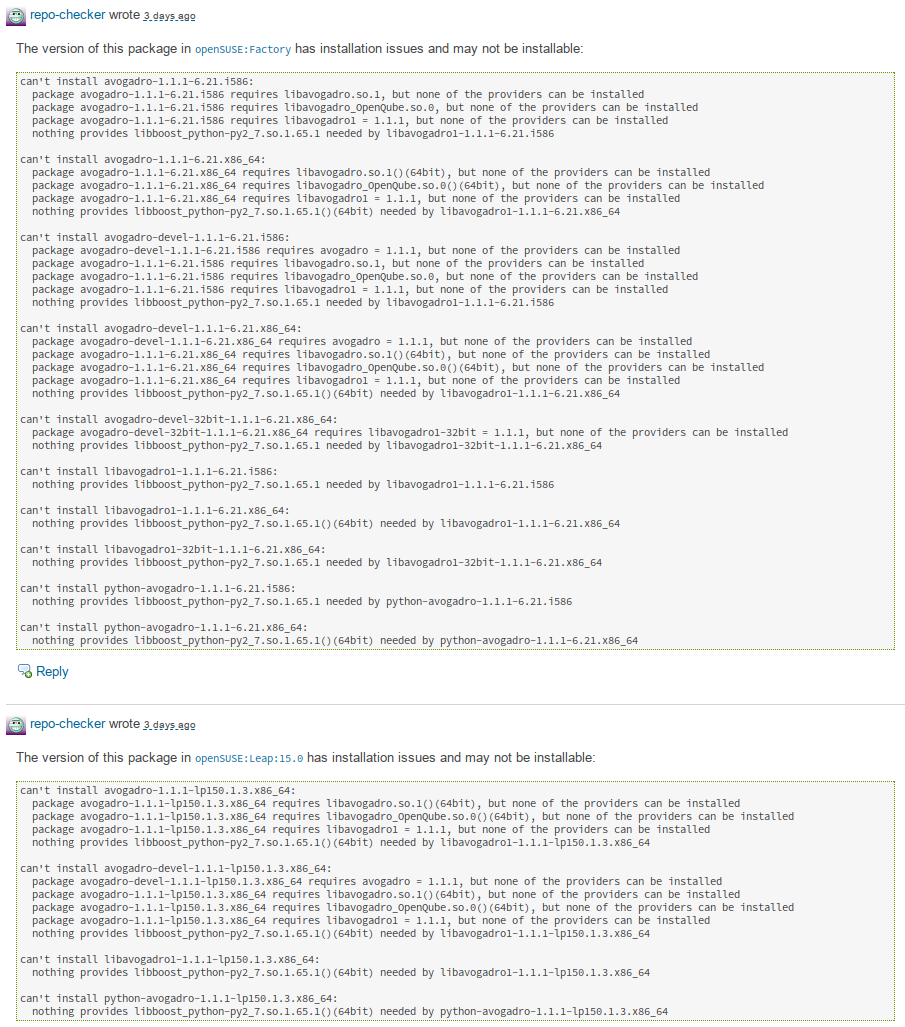
The difference being that i586 is built in Factory, but not Leap.
Another example, from devel:tools:scm/git, demonstrates the importance of posting comments from both target projects since the issue only exists in Leap.

In addition to supporting multiple target projects, the pull request also introduced a configuration option to post comments directly on the packages within the target project. This feature is now used for SLE development which also improves the Leap workflow since many packages come from SLE and the additional check improves the quality of those submissions.
announcer packaging and deployment for Leap 15.0
Leap 42.3 used the announcer to send email notifications of new builds during it pre-release cycle starting with beta. In preparation for using the announcer for Leap 15.0 the various configuration and service bits that were not yet polished and placed in git were merged. After which the package was simply updated and the announcer enabled for Leap 15.0. This is part of a ongoing effort to migrate all services to those provided by the package in order to simplify and ease maintenance.
CI tweaks and osc crash caught
Since requests are now automatically submitted to Leap 15.0 from Factory the openSUSE-release-tools package was submitted which broke the automatic deployment. Before a request is created to submit the package to Factory it checks to ensure there are no existing requests to avoid spamming, but the osc request list command does not differentiate between requests targeting the package or being sourced from it. As such the Leap requests were detected as existing requests. The problem was resolved by replacing the osc command with a custom API call.
Since the CI is ensured to run at least once every 24 hours, after recent tweaks, changes to upstream dependencies (like OBS and osc) that break the release tools are caught quickly. One such occurance was caught that caused osc to crash on init. This confirmed the setup works well and allows for such issues to be caught before deployed in production.
devel project code standardized
Over the last year, the various implementations for retrieving devel project and falling back when not available have been extracted and refactored into common ones. The final request to merge the common implementations remaining into one function (and fix some bugs) was merged. With that refactoring completed the check_source bot could use the fallback code to handle add_role requests to Leap properly. Nothing too exciting, but helpful towards maintaining the code going forward as previously the same problem had to be fixed in each implementation.
post-accept staging todo list
One of the cumbersome bits to the workflow is communicating/remembering manual steps that need to be taken after a staging is accepted. In lieu of the tools handling everything automatically a todo field was added to allow staging masters to record information to be displayed after a staging is accepted. This builds atop the staging specific config feature added and is thus rather simple to implement.
status check
In preparation for providing public status information a tool for determining if the various bots are running properly was created. The intent is to integrate it into a public status site and/or provide alerts to staging masters.
dashboard
The staging dashboard was improved by krauselukas to include ready requests (adi requests ready to be accepted) and provide links to see all the requests in the various states. This is not only helpful for staging masters to get a quick overview, but helpful to clarify the process to contributors.
last year
During this time last year, an issue reference diffing tool was created to aid in ensuring all fixes from SLE made their way into Factory by comparing the issues referenced in package change logs. The leaper bot was also extended to support SLE and further merged the workflows to allow for investment into the same toolset.
In an effort to improve the staging osc plugin responsiveness the underlying devel project query was reworked to avoid an expensive query that using timed out after 5-10 minutes. The result was a significant speed up.

LibreOffice Development Talk at Triangle C++ Developer’s Group
It was a pleasure to have been given an opportunity to talk about LibreOffice development the other day at the Triangle C++ Developer’s Group. Looking back, what we went through was a mixture of hardship, accomplishments, and learning experience intertwined in such a unique fashion. It was great to be able to talk about it and hopefully it was entertaining enough to those of you who decided to show up to my talk.
Here is a link to the slides I used during my talk.

Thanks again, everyone!
Edit: Here is a PDF version of my slides for those of you who don’t have a program that can open odp files.

Creating openSUSE-style btrfs root partition & subvolumes
openSUSE’s YaST installer creates a detailed btrfs root filesystem configuration that has been designed to be flexible and secure while still efficient when used with tools like Snapper.
One of the overriding requirements is to provide a clearly defined ‘root filesystem’ containing everything we care about for ‘full system rollback’ (facilitated by snapper), while using subvolumes to exclude everything we do not want in the ‘root filesystem’ so snapper does not accidentally destroy user data when rolling back the system and its’ applications. Details of our default subvolume layout can be found on the openSUSE wiki.
However this does lead to complications for some advanced users who wish to recreate this manually, such as when doing complex system recovery, custom automated provisioning or other tinkering. (NOTE: for Full System Recovery it is often better to use a tool like ReaR).
The below steps are the steps to manually create an openSUSE-style btrfs partition believed to be correct at time of writing (19 Jan 2018).
This guide should be valid for openSUSE Tumbleweed 20180117, openSUSE Leap 15, and SUSE Linux Enterprise 15 or later. However care should be taken to double check for new or removed subvolumes in *SUSE distributions as this document gets older.
Older versions of SUSE distributions will need to adjust these instructions to handle the old /var/* subvolume layout previously used.
It should go without saying that this guide should only be followed by people who feel that they know what they are doing. It’s normally a lot easier to use openSUSE’s default tools like YaST and ReaR.
Step-by-Step
For this example we will use /dev/sda as our example disk and /dev/sda1 as our example partition for a btrfs root filesystem.
1: Create a partition table and the partition to be used as our root filesystem using your favourite tool (eg. yast, parted, fdisk)
2: Format /dev/sda1 with a btrfs filesystem
mkfs.btrfs /dev/sda1
3: Mount the new partition somewhere so we can work on it. We’ll use /mnt in this example.
mount /dev/sda1 /mnt
4: Create the default subvolume layout (this assumes an intel architecture, the /boot/grub2/* paths are different for different architectures)
btrfs subvolume create /mnt/@
btrfs subvolume create /mnt/@/.snapshots
mkdir /mnt/@/.snapshots/1
btrfs subvolume create /mnt/@/.snapshots/1/snapshot
mkdir -p /mnt/@/boot/grub2/
btrfs subvolume create /mnt/@/boot/grub2/i386-pc
btrfs subvolume create /mnt/@/boot/grub2/x86_64-efi
btrfs subvolume create /mnt/@/home
btrfs subvolume create /mnt/@/opt
btrfs subvoulme create /mnt/@/root
btrfs subvolume create /mnt/@/srv
btrfs subvolume create /mnt/@/tmp
mkdir /mnt/@/usr/
btrfs subvolume create /mnt/@/usr/local
btrfs subvolume create /mnt/@/var
5: Disable copy-on-write for var to improve performance of any databases and VM images within
chattr +C /mnt/@/var
6: Create /mnt/@/.snapshots/1/info.xml file for snapper’s configuration. Include the following content, replacing $DATE with the current system date/time.
<?xml version="1.0"?>
<snapshot>
  <type>single</type>
  <num>1</num>
  <date>$DATE</date>
  <description>first root filesystem</description>
</snapshot>
7: Set snapshot 1 as the default snapshot for your root file system, unmount it, and remount it.
btrfs subvolume set-default $(btrfs subvolume list /mnt | grep "@/.snapshots/1/snapshot" | grep -oP '(?<=ID )[0-9]+') /mnt
unmount /mnt
mount /dev/sda1 /mnt
8: You should be able to confirm the above worked by doing ls /mnt which should repond with an empty result.
Congratulations, at this point the filesystem is ‘created’ with the correct structure. But you need to know how to mount it properly to make use of it.
9: You now need to create a skeleton of the filesystem to mount all of our subvolumes
mkdir /mnt/.snapshots
mkdir -p /mnt/boot/grub2/i386-pc
mkdir -p /mnt/boot/grub2/x86_64-efi
mkdir /mnt/home
mkdir /mnt/opt
mkdir /mnt/root
mkdir /mnt/srv
mkdir /mnt/tmp
mkdir -p /mnt/usr/local
mkdir /mnt/var
10: Mount all of the subvolumes
mount /dev/sda1 /mnt/.snapshots -o subvol=@/.snapshots
mount /dev/sda1 /mnt/boot/grub2/i386-pc -o subvol=@/boot/grub2/i386-pc
mount /dev/sda1 /mnt/boot/grub2/x86_64-efi -o subvol=@/boot/grub2/x86_64-efi
mount /dev/sda1 /mnt/home -o subvol=@/home
mount /dev/sda1 /mnt/opt -o subvol=@/opt
mount /dev/sda1 /mnt/root -o subvol=@/root
mount /dev/sda1 /mnt/srv -o subvol=@/srv
mount /dev/sda1 /mnt/tmp -o subvol=@/tmp
mount /dev/sda1 /mnt/usr/local -o subvol=@/usr/local
mount /dev/sda1 /mnt/var -o subvol=@/var
11: You’re done, you’ve now successfully created an openSUSE-style btrfs root filesystem structure and mounted it for use. You can now use it for whatever you’d like, such as the manual injection of files from an existing openSUSE installation.
Once populated, care should be made to ensure the /mnt/etc/fstab also includes the appropriate entries for each of the subvolumes except @/.snapshots/1/snapshot which should not be mounted as it provides your initial installed system.
Have a lot of fun

Meltdown and Spectre Linux Kernel Status - Update
I keep getting a lot of private emails about my previous post about the latest status of the Linux kernel patches to resolve both the Meltdown and Spectre issues.
These questions all seem to break down into two different categories, “What is the state of the Spectre kernel patches?”, and “Is my machine vunlerable?”
State of the kernel patches
As always, lwn.net covers the technical details about the latest state of the kernel patches to resolve the Spectre issues, so please go read that to find out that type of information.
Fun with Rust (not spinning this time)
Hey Intel, what about an apology?
(And yes, Spectre is industry-wide problem. Meltdown is -- you screwed it up.)