
Ruby, Plasma, GTK Update in Tumbleweed
There were a total of four openSUSE Tumbleweed snapshots released this week.
Snapshot 20211117 gave KDE users the Plasma 5.23.3 update. The bug-fix release had changes for the systemsettings5 package, which had a fix for a touchscreen click. The plasma-desktop had a fix involving drag and drop that reset a position and overlap; the package also had a fix showing an inactive kwin console. The kwin package also made some fixes that prevented crashing of screencasting and provided a couple fixes for Wayland. The update of kplotting was the single KDE Frameworks 5.88.0 package updated in the snapshot; the rest came in the previous day’s snapshot. Xfce users also had an update in the snapshot with xfce4-whiskermenu-plugin 2.6.2, which provided a fix for the menu not toggling after pressing escape. The package also fixed shifting the background when showing the menu. Other packages to update in the snapshot were fribidi 1.0.11 and restorecond 3.3, which is a daemon that watches for file creation.
Many of the KDE Frameworks 5.88.0 packages arrived in snapshot 20211116. Updates to improve the Open/Save Advanced Dialog were made to KTextEditor, and plugin KParts deprecated unused and internal methods. Small improvements were in the Application Programming Interfaces documentation for Kirigami; the User Interface framework package also fixed issues with setting components on a tablet. The plasma-framework package added additional keyboard navigation, increased tab margins for visual styles and gave breeze buttons a more realistic shadow. KDE users weren’t the only ones to gain fixes and features from the very large snapshot. An updated of btrfsprogs 5.15 made new defaults for mkfs and fixed warnings regarding a v1 space cache when only v2 (free space tree) is enabled. GTK4 disabled SassC build requirement when building from git and dropped a configuration that is related 32-bit and likely not being consumed, according to the changelog. Both ruby 2.7.4 and 3.0.2 were updated in the snapshot to address a few Common Vulnerabilities and Exposures. The update of mariadb 10.6.5 dropped some patches and had no effect from CVE-2021-35604, which affected other database management systems. Two CVEs were fixed in the postgresql14 14.1 update; one of those made the server reject extraneous data after an SSL or GSS encryption handshake. The update of libreoffice 7.2.3.1 dropped two patches. Vim 8.2.3587, xen 4.16.0 and yast2-network 4.4.31 were among many packages and libraries to update. There were more than 30 additional packages to update in the snapshot.
Just two package came in snapshot 20211111. The major version of coreutils 9.0 arrived in the snapshot. The chmod -v no longer misreports modes of dangling symlinks, which was a bug introduced in coreutils-5.3.0. Several more bug were fixed and there were new features added like cksum now supports the -a (--algorithm) option to select any of the existing sum, md5sum, b2sum, sha*sum implementations etc. cksum now subsumes all of these programs, and coreutils will introduce no future standalone checksum utility. There were a large amount of bug fixes and new features in the update of xorg-x11-server to version 21.1.1. X server now correctly reports display DPI in more cases, which may affect rendering of client applications that have their own workarounds for hi-DPI screens.
The snapshot to start the week off was 20211110. This snapshot updated Mozilla Firefox to version 94.0.1, which gives power users an about:unloads to release system resources by manually unloading tabs without closing them. Vim also had an update in this snapshot to version 8.2.3582; the text editor had some reading of uninitialized memory when giving spelling suggestions. Other packages to update in the snapshot were xwayland 21.1.3, ceph 16.2.6.462, and several pypi packages.
The Tumbleweed-Review sent to the Factory mailing list reveals that Linux Kernel 5.15.2 (with kernel modules compression using zstd), ICU 70.1, Mesa 21.3.0 and cmake 3.22.0 are being tested and are in the staging projects for future release.

 Member
 CzP
CzPSending logs from syslog-ng store box to Splunk
One of the most popular applications to feed Splunk with syslog messages is syslog-ng. However not everyone is happy to work on the command line anymore. This is where syslog-ng store box (SSB), an appliance built around syslog-ng, can help. The SSB GUI provides you not only with an easyto-use interface to configure most syslog-ng features, but also a search interface and complete log life cycle management. It can forward log messages to several destinations, recently also to Splunk’s HTTP Event Collector (HEC).
From this blog you can learn about how SSB fits into your logging infrastructure and how to configure SSB for Splunk: https://www.syslog-ng.com/community/b/blog/posts/sending-logs-from-syslog-ng-store-box-to-splunk

Clean empty job groups in openQA
In this blog post I present you a small script, which can help you to remove empty job groups from your own openQA instance. This is helpful if you have a development instance with a lot of job groups, that you never use. This script can help you to tidy the list of dangling job groups.
High-Resolution Audio: is it worth the hype?
Can you hear the difference between a CD and an MP3 file? Most people cannot. But even if only one in ten can hear something, that means hundreds of millions of people. However, even if you can hear the difference, there is a good chance that the recording you love is not available in better than CD quality. Still, this problem is not as big as you first think. Let me show you why!
The topic of high-resolution audio (or HiRes audio for short) comes up often in my discussions. In this blog, I try to summarize my experiences in a few simple points. Note: everything I write here is based on what I hear. I did not do any research or had any formal education about audio.
Equipment
A HiRes sticker on an audio equipment does not mean that it sounds good. All it means that you paid extra for that sticker. For example, the headphones output on my good, old MacBook Pro does not support HiRes audio, yet still I use that whenever I need to use headphones. I use that even if I have a dedicated DAC / headphones amplifier supporting HiRes audio. My company laptop, on the other hand, also supports 192kHz. Using it, I could easily spot the difference among various audio resolutions. However, even without HiRes audio, the headphones output of that old MacBook Pro sounds a lot better. I had a similar case over a decade ago: long after the EFIKA MX from Genesi reached end-of-life, I still used it to listen to music. I had similar experiences with speakers and hifi systems as well.
So in short, a HiRes sticker alone does not solve your music listening problems. A low-cost device without supporting HiRes can still sound (a lot) better. You need to have quality audio equipment in order to actually enjoy the difference.
Environment
Do you live next to a busy street or a highway? Does your computer have loud cooling? Is there air conditioning is in your room? You do not have air conditioning and it’s too hot to stay there with closed windows? Then, I have some bad news for you. While you might hear the difference between mp3 and CD even in a noisy environment, the advantages of HiRes audio are fully (or at least mostly) lost in such cases.
To appreciate the quality of HiRes recordings, you need an environment where you can actually hear the difference.
Time
Do you have time dedicated to listening to music? My experience is that MP3 quality music can sometimes annoy the hell out of me, even if I listen to it as background music. I can still sense the missing details and my brain works hard trying to figure out what is wrong. However, listening to CD quality or HiRes audio does not make much difference when played in the background. Your mileage may vary, but I can really appreciate the added quality of HiRes audio only when I am focusing on the music.
If you do not have the time or the mood to focus on the music and nothing else, listening to HiRes audio does not have any added value.
Music
In the introduction, I mentioned that not all music is available in HiRes quality. And I am not worried about this. I have a quite large CD collection. I listened to many of those in various HiRes formats: FLAC, DSD or MQA (on TIDAL). I can hear the difference. But for many of the music I listen to, I need to listen carefully. With 3x the price and 3x the storage area, there is often only minimal improvements in audio quality. The “Atom Heart Mother” album by Pink Floyd in 192kHz/24bit set me back with more than 3 months of subscription fee for TIDAL. Was it worth it? Definitely. A good recording became even better: all the little noises became completely life-like. However, another album I bought at the same time for the price did not feel anything special.
Of course, there are genres which make better use of HiRes. No wonder that most of the HiRes capable equipment is sold with jazz or classical recordings. Luckily, there are many albums belonging to these both on TIDAL or HDTracks. However, my guess is that much of the albums available in HiRes formats do not make much use of the extra audio quality. They are sold in HiRes format only to generate some extra income for the musician and/or record label.
Conclusion
As you can see, there is no easy and straightforward answer for my initial question. You need the right equipment, the right environment, dedicated time and suitable music to enjoy the advantages of HiRes audio. And, of course, a good pair of ears is also a prerequisite. :-)
openSUSE Tumbleweed – Review of the week 2021/45
Dear Tumbleweed users and hackers,
Tumbleweed keeps being predictable when it comes to the update cadence. This week, we could publish 5 fully tested snapshots (1104, 1105, 1106, 1107, and 1110).
The main changes contained in these snapshots were:
- Mozilla Thunderbird 91.3.0
- Mozilla Firefox 94.0.1
- KDE Gear 21.08.3
- Meson 0.59.4
- GNOME 41.1
- Libvirt 7.9.0
- More improvements to rpmlint 2
Based on the staging projects and the snapshot currently under build, we predict to be able to deliver these items soon :
:
- Coreutils 9.0
- X.org server 21.1: the reported DPI change has been reverted, as it was much more intrusive than anticipated
- XEN 4.16.0
- Linux kernel 5.15.1: in a later step, the compression method for kernel modules will be changed from xz to zstd
- Rust 1.56
- ICU 70.1
- Bash: moving away from update-alternatives to handle /bin/sh; To allow busybox to step in as ‘sh’ provider, we are switching to a package replacement model (e.g. bash-sh, busybox-sh). Those packages will install the relevant /bin/sh symlinks
- tbb 2021.4: breaks opencv3
- gc 8.2.0: breaks texlive and guile
- openSSL 3.0: No visible progress in the staging. Main blockers so far seems to be python 3.6 and python-cryptography
Celebrating 30 years of Linux - is 2021 finally the year of the Linux desktop?
Celebrating 30 years of Linux - is 2021 finally the year of the Linux desktop?
My favorite Linux insider joke is that “The year of the Linux desktop is always next year”. Each year there is a new technology which is expected to achieve breakthroughs. I was asked almost a decade ago to give a talk about this topic. I proved to my audience that the year of the Linux desktop is already here, just not the way most Linux users expect it. Hopefully it will be even easier now!
Linux was born 30 years ago.
I started to use Linux just three years later. The first machine where I installed Linux was an i486 box with 8 MB (not GB!) of RAM. I brought Linux home on floppy disks and did not install a graphical user interface (GUI). Next I installed Linux on an i386 box with 16 MB of RAM, an unbelievably large RAM size at that time. I made my first steps with a GUI on Linux there. I used the FVWM2 window manager on top of X11 and ran Netscape Navigator to browse the web.
Read the rest of my blog at https://www.mndwrk.com/blog/celebrating-30-years-of-linux-is-2021-finally-the-year-of-the-linux-desktop

Installing openSUSE Tumbleweed on the Enclustra Mars MA3
As part of my school internship at TEM Messtechnik I got the oppertunity to work on the Enclustra Mars MA3, a FPGA SoC with two ARMv7 cores. This post describes the process of getting Linux (more precisely, openSUSE Tumbleweed) to work on this SoC.
Requirements
In order to build and install all the needed files, you’re gonna need the following:
- 1x Enclustra Mars MA3
- 1x Enclustra Mars EB1
- A computer capable of running Linux, in this case openSUSE Tumbleweed
- A computer running Windows (we need it for the flash tool)
- 1x MicroSD Card.
Setting up the build environmentee
Setting up the build environment is not difficult, but it is not a “clean” way of using a Linux system. We’re gonna need some packages that are not maintained anymore and are therefore not avaliable in the openSUSE Tumbleweed repositories. Installing packages from unofficial repositorys can be dangerous for your system though, so the first thing we’re gonna do is create a filesystem snapshot:
snapper create --description "Snapshot before installing Enclustra build environment"
This will create a Btrfs snapshot so that we can rollback (snapper rollback)to the state of the system before installing the build environment. Because no --cleanup-algorithm is specified this snapshot will not get removed after a certain period of time.
First, we need to add some repositorys:
sudo zypper ar https://download.opensuse.org/repositories/Kernel:/tools/openSUSE_Factory/Kernel:tools.repo
sudo zypper ref
Now we can install all the dependencies we need:
sudo zypper install gcc48 gcc48-c++ git autoconf bc curl glibc-32bit mercurial unzip wget make patch openssl-devel python3-termcolor
In addition, we need a really old version of python-dialog, which is not avaliable for Tumbleweed, so we need to install it manually from an unsupported repository:
sudo zypper in https://download.opensuse.org/repositories/openSUSE:/Leap:/42.3/standard/noarch/python-dialog-3.3.0-8.1.noarch.rpm
Under normal circumstances, you should never ever install a package from Leap in Tumbleweed! The only reason we can do this here is that Leap 42.3 won’t change anymore (since it is discontinued) and I tested that everything works. Never do this regularly!!! You have been warned.
We need to set the default compiler:
sudo update-alternatives --install /usr/bin/gcc gcc /usr/bin/gcc-4.8 50
sudo update-alternatives --install /usr/bin/g++ g++ /usr/bin/g++-4.8 50
sudo update-alternatives --install /usr/bin/cc cc /usr/bin/gcc-4.8 50
Now, we can finally install the buildtool:
git clone https://github.com/enclustra-bsp/bsp-altera.git && cd bsp-altera
Since we want to get openSUSE Tumbleweed running instead of the default (bare bones) Linux Enclustra provides, we do not need to build the root filesystem. We do need to build however a bootloader (U-Boot) and a Linux Kernel. Both these parts are part of the openSUSE distribution, but the versions in the repositorys are not compatible with the Mars MA3, so we need to build the versions provided by Enclustra. The version of the Linux kernel provided is not up to date though, but I won’t go into detail on how to build an upstream Linux kernel in this post.
To start the build process, run
./build.sh -d Mars_MA3/Mars_EB1/MMC -x Linux -x U-Boot
The process is going to take some time, so go grab some tea (or coffee, if you prefer that for whatever reason…).
After the build succeeds, you can find the build results in a folder named out_<timestamp>_<module>_<board>_<bootmode>.
In my case that is out_20211105094426_Mars_MA3_Mars_EB1_MMC.
Partitionizing the SD Card
The SoC expects a specific partitionizing on our SD card, which we need to create manually using fdisk (replace /dev/mmcblk0 with the block name of the SD card):
sudo fdisk /dev/mmcblk0
Use fdisk as the following:
Welcome to fdisk (util-linux 2.36.2).
Changes will remain in memory only, until you decide to write them.
Be careful before using the write command.

Device does not contain a recognized partition table.
Created a new DOS disklabel with disk identifier 0x99faaaa1.

Command (m for help): o
Created a new DOS disklabel with disk identifier 0x8c918d1b.

Command (m for help): n
Partition type
   p   primary (0 primary, 0 extended, 4 free)
   e   extended (container for logical partitions)
Select (default p): p
Partition number (1-4, default 1): 2
First sector (2048-16777215, default 2048):
Last sector, +/-sectors or +/-size{K,M,G,T,P} (2048-16777215, default 16777215): +2M

Created a new partition 2 of type 'Linux' and of size 2 MiB.

Command (m for help): a2
Selected partition 2
The bootable flag on partition 2 is enabled now.

Command (m for help): n
Partition type
   p   primary (1 primary, 0 extended, 3 free)
   e   extended (container for logical partitions)
Select (default p): p
Partition number (1,3,4, default 1): 1
First sector (6144-16777215, default 6144):
Last sector, +/-sectors or +/-size{K,M,G,T,P} (6144-16777215, default 16777215): +200M

Created a new partition 1 of type 'Linux' and of size 200 MiB.

Command (m for help): t
Partition number (1,2, default 2): 1
Hex code or alias (type L to list all): c

Changed type of partition 'Linux' to 'W95 FAT32 (LBA)'.

Command (m for help): n
Partition type
   p   primary (2 primary, 0 extended, 2 free)
   e   extended (container for logical partitions)
Select (default p): p
Partition number (3,4, default 3): 3
First sector (415744-16777215, default 415744):
Last sector, +/-sectors or +/-size{K,M,G,T,P} (415744-16777215, default 16777215):

Created a new partition 3 of type 'Linux' and of size 7.8 GiB.

Command (m for help): w
The partition table has been altered.
Syncing disks.
After the partitioning is done, we can download the Tumbleweed root filesystem, which gets built by the openSUSE Build Service. Our SoC has an armv7 architecture, so we need the rootfs for that specific architecture.
Download the image wget:
wget http://download.opensuse.org/ports/armv7hl/tumbleweed/appliances/openSUSE-Tumbleweed-ARM-JeOS.armv7-rootfs.armv7l.tar.xz
You’re also gonna need my deploy script, which makes flashing everything to a MicroSD card really simple. Download it and make it executable:
wget https://code.opensuse.org/KaratekHD/MA3/raw/main/f/deploy.py
chmod +x deploy.py
Usage of the deploy script is really simple:
usage: deploy.py [-h] -r ROOTFS -d DEVICE -i INPUT_DIR

Deploy openSUSE Tumbleweed to the Mars MA3.

optional arguments:
  -h, --help            show this help message and exit
  -r ROOTFS, --rootfs ROOTFS
                        Path to rottfs.tar
  -d DEVICE, --device DEVICE
                        Deviceprefix to deploy to (e.g. /dev/mmcblk0p)
  -i INPUT_DIR, --input_dir INPUT_DIR
                        Build files generated by build.sh
An example of using the deploy script:
./deploy.py \\
-d /dev/sdb \\
-r /home/jens/bsp-altera/openSUSE-Tumbleweed-ARM-JeOS.armv7-rootfs.armv7l.tar.xz \\
-i out_Mars_MA3_Mars_EB1_MMC/
Replace the paths with the ones matching for your situation.
Warning: If your SD-Card is the block device /dev/sdb, use dev/sdb as the parameter for -d. If your block device is e.g. /dev/mmcblk0 , you’ll need to use /dev/mmvblk0p as the parameter for -d.
Also, it is important that you use an absolut path for the rootfs, even if it is located in the same directory.
The script will ask for your root password and then
- Format the partitions of the SD card with the required file systems
- Flash the preloader and the Linux Kernel
- Extract the rootfs to the SD card
An example output would be:
Formatting partition 1 with fat32...
mkfs.fat 4.2 (2021-01-31)
Formatted partition 1
Formatting partition 3 with ext2...
mke2fs 1.46.4 (18-Aug-2021)
/dev/sdb3 contains a ext2 file system labelled 'rootfs'
	last mounted on / on Thu Jan  1 01:00:01 1970
Proceed anyway? (y,N) y
Creating filesystem with 15539968 4k blocks and 3891200 inodes
Filesystem UUID: b229ef5a-d94a-4851-bd70-c8c00c52fadb
Superblock backups stored on blocks:
	32768, 98304, 163840, 229376, 294912, 819200, 884736, 1605632, 2654208,
	4096000, 7962624, 11239424

Allocating group tables: done
Writing inode tables: done
Writing superblocks and filesystem accounting information: done

Formatted partition 3
Flashing preloader...
512+0 records in
512+0 records out
262144 bytes (262 kB, 256 KiB) copied, 0.0645477 s, 4.1 MB/s
Preloader flashed!
Syncing...
Synced!
Mounting /mnt/rootfs
Mounting /mnt/boot
Copying files to /mnt/boot
- uImage
- devicetree.dtb
- fpga.rbf
- u-boot.img
- uboot.scr
Removing everything from /mnt/rootfs...
Extracting rootfs from /home/jens/bsp-altera/openSUSE-Tumbleweed-ARM-JeOS.armv7-rootfs.armv7l.tar.xz to /mnt/rootfs...
Extracted /home/jens/bsp-altera/openSUSE-Tumbleweed-ARM-JeOS.armv7-rootfs.armv7l.tar.xz to /mnt/rootfs
Syncing...
Umounting devices...
Done
After the script did its magic, it’s time to move on.
Building U-Boot
In our experiences, we couldn’t get the SoC to use the U-Boot image deployed to the SD Card. U-Boot is, however, required to boot the Linux kernel, so we need some other way to get U-Boot to run, which, in this case, is to flash it to the QSPI Flash of the SoC itself.
In order to do this, we need to build a version of U-Boot that works from QSPI. To do this, navigate to the build directory and run
./build.sh -d Mars_MA3/Mars_EB1/QSPI -x U-Boot
Now, navigate into the output folder (e.g. ./out_Mars_MA3_Mars_EB1_QSPI) and transfer u-boot.img and preloader-mkimage.bin to the Windows PC.
Setting up the board
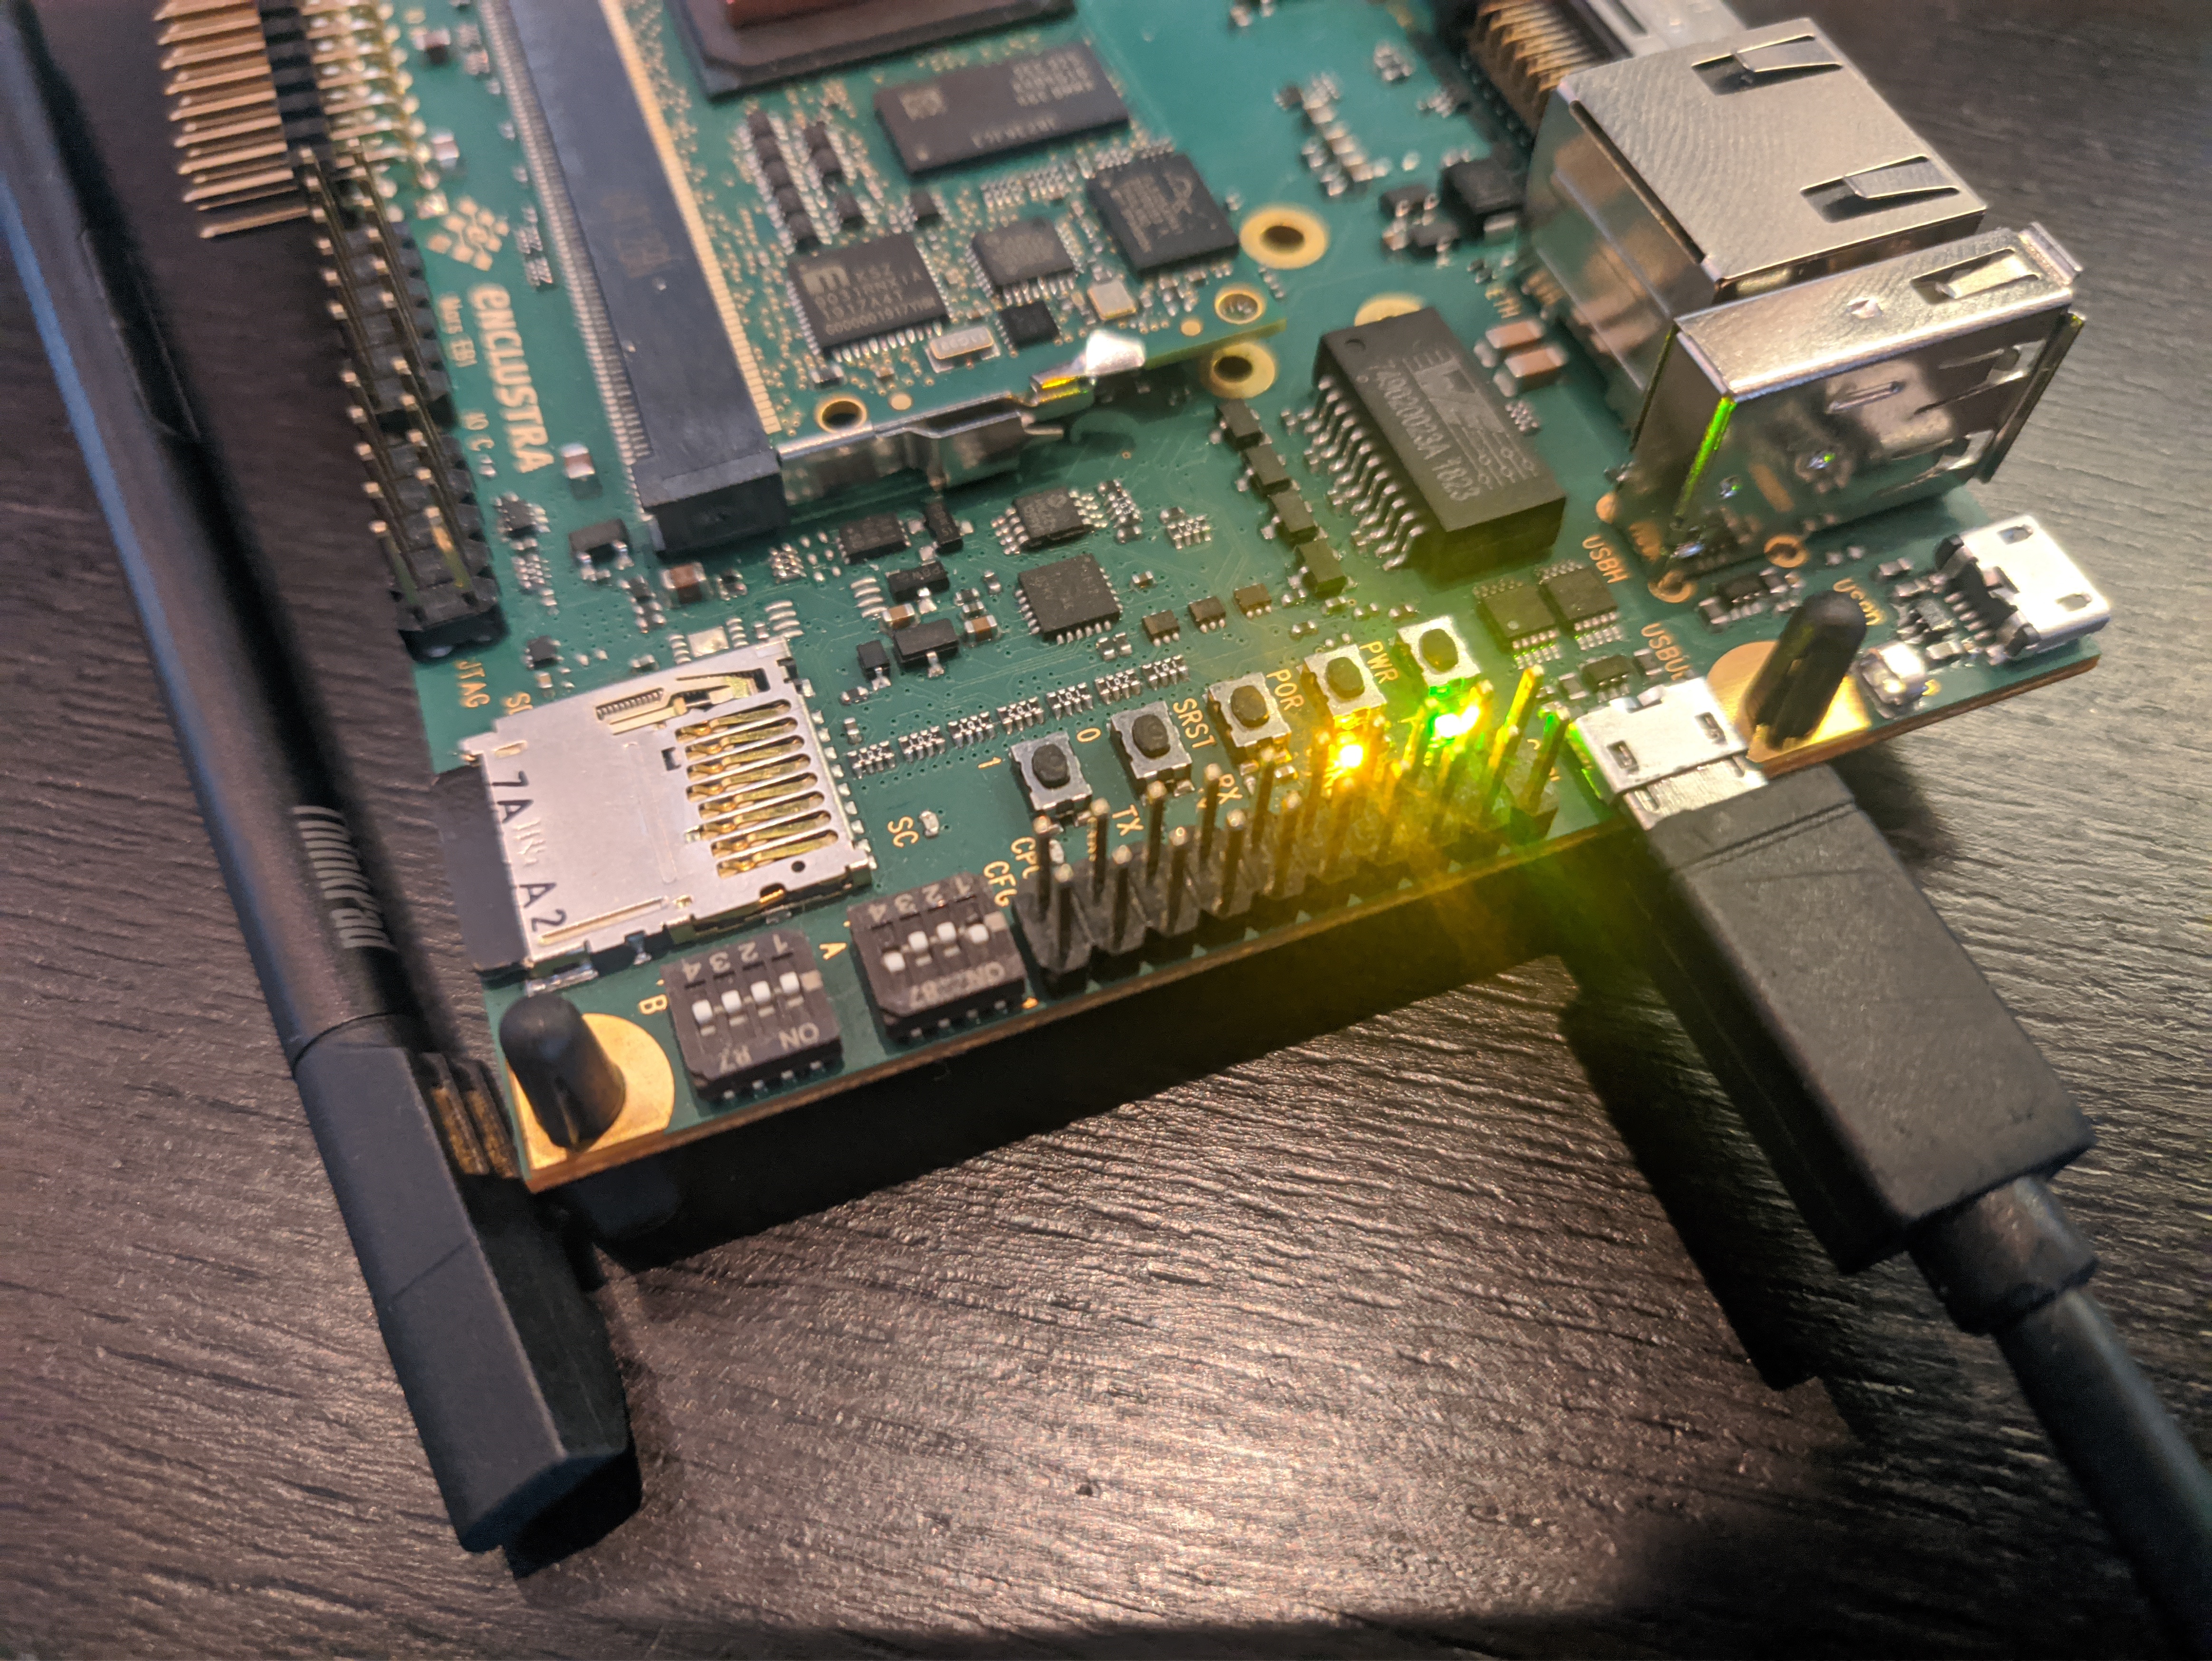 In order to get the board to boot from the QSPI Flash (and aafter that from the SD card) and to give us a seral output, we need to set up the dipswitches (see above) as following:
| Dipswitch | Value |
|---|---|
| A1 | On |
| A2 | Off |
| A3 | Off |
| A4 | On |
| B1 | Off |
| B2 | Off |
| B3 | Off |
| B4 | Off |
Now you can connect a Micro-USB cable to USBUB (see the image above) and use it to flash to the QSPI and use a serial console as described below.
Flashing the bootloader
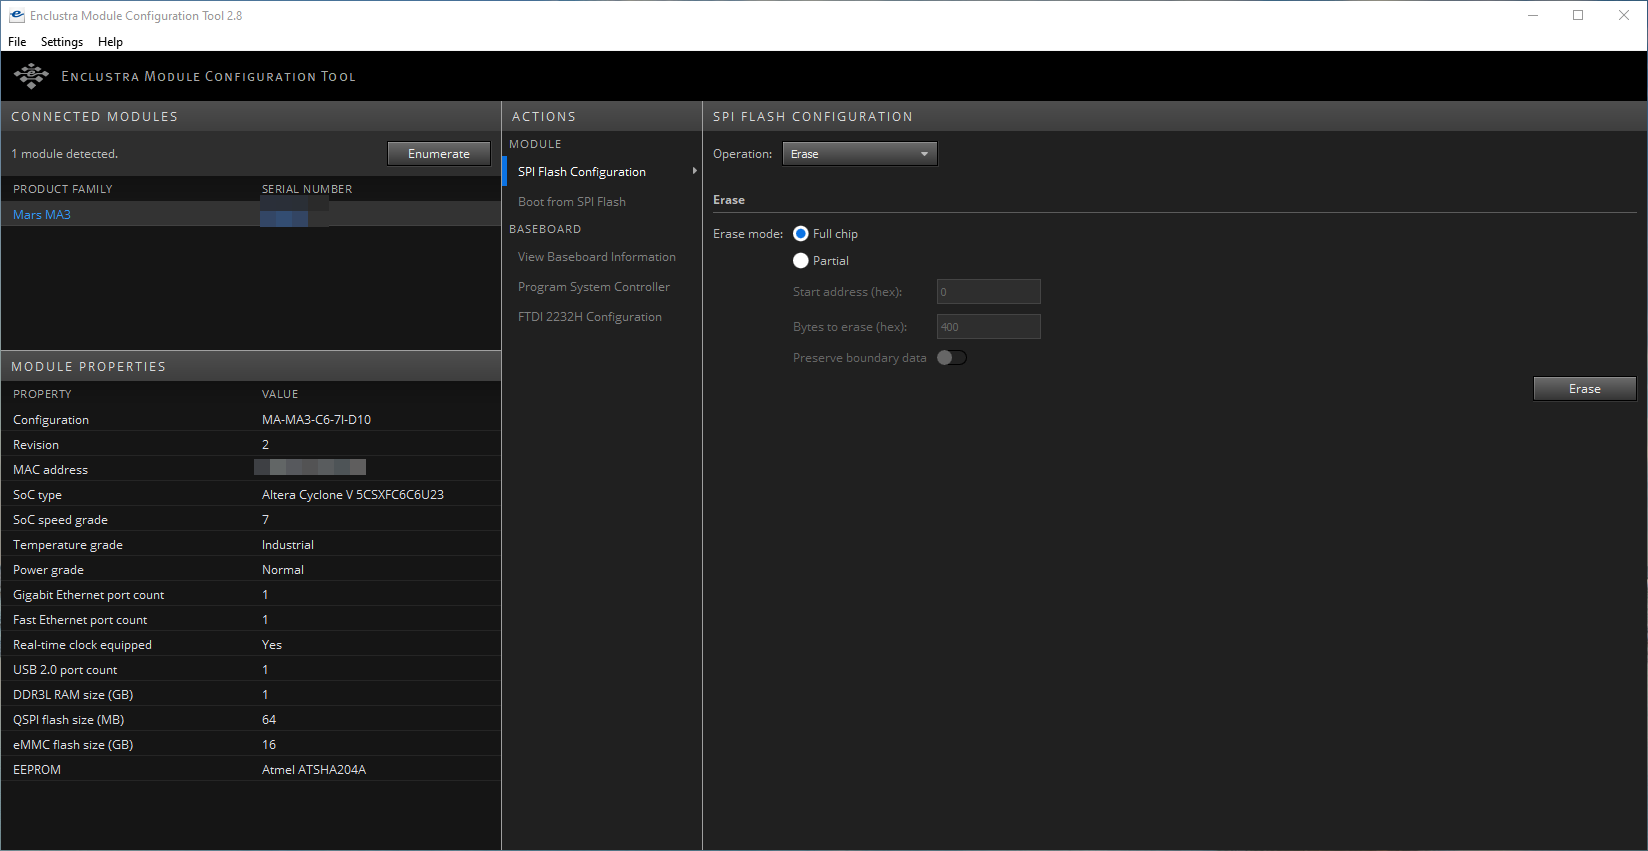
Connect the Board to the Windows PC via USB, power it using the dc input on the evaluation board and click on “Enumerate” in MCT. Make sure no other serial devices are connected to your PC. For example a USB-Jtagger can cause problems. The board should show up in the list.
In the “Operation” drop-down menu, select “Erase”, select “Full chip” and click on the “Erase” button:
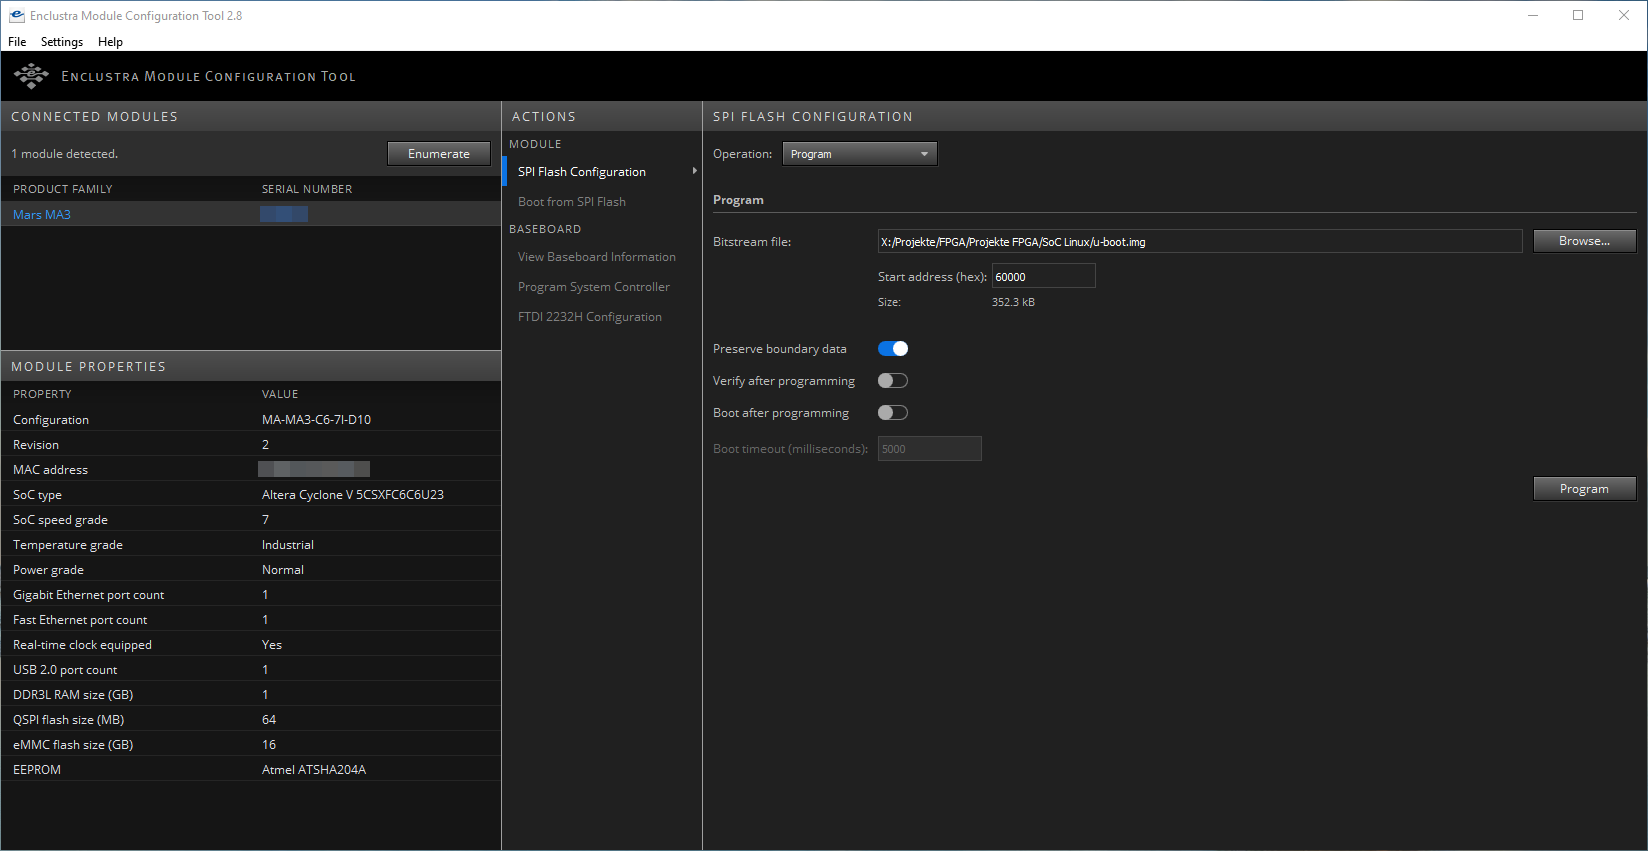
In the next step, select “Program” from the “Operation” drop-down menu. Set the Start address to 0, enable “Preserve boundary data” and disable “Boot after programming”. Now select the preloader-mkimage.bin file as the Bitstream file and click on “Program”.
Once the preloader has been flashed, set the Start address to 6000 and select the U-boot.img file as the bitstream file. Keep the rest of the settings as descibed above and click “Program” again.
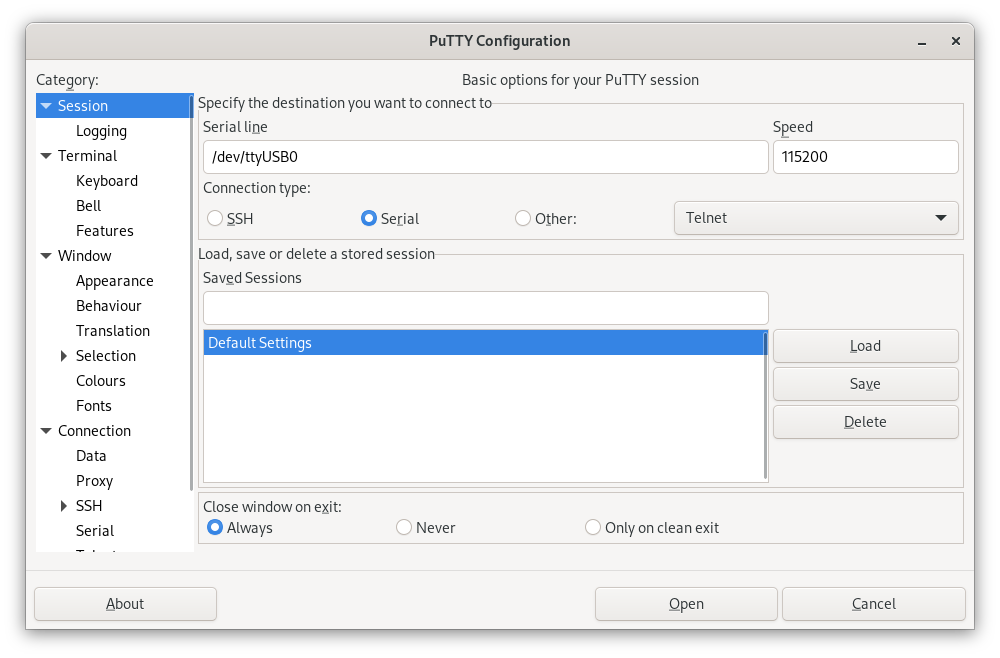
Connecting to a serial console
Now connect the Board to a PC via USB (TODO @Phillip: Switches für Serielle Konsole?). Use Putty, Minicom, Picocom or whatever tool you prefer to use to connect via serial to the Board, just make sure to set the Baudrate to 115200.
Configuring U-Boot
With a serial console connected, power on the Board. You’ll see some output, but wait until you see a little arrow (=>) in the line at the bottom.
Now, type
setenv bootcmd "run mmcboot"
saveenv
Now your board will boot from the SD card by default. Now it’s time to actually boot Linux, so power off the board. U-Boot does not have a shutdown command, so just pull the power plug.
Booting the Linux operating system
Insert the MicroSD card into the slot on the Board. and power on the board. This time you should get a lot more output then before, because this time it actually boots into Linux. There are gonna be a lot of lines starting with [OK] in green, but also a few starting with a red [FAILED]. That’s fine though, everything works even with these minor failures.
Once it’s done booting, you should see something like this on the serial console:
Welcome to openSUSE Tumbleweed 20211107 - Kernel 4.15.0-g506369939 (ttyS0).

eth0:

localhost login:
That’s it! You succesfully installed openSUSE Tumbleweed on your Mars MA3, sou you can now use it like every regular Tumbleweed machine. The default credentials are root:linux, so make sure to change them using passwd before doing anything else. I also recommend to do a quick zypper dup before starting to work on the SoC.
Further reading
- Enclustra Build Environment documentation
- openSUSE on your ARM board
- Source code for the deploy script
KDE Gear, GNOME Update in Tumbleweed
Tumbleweed pulled back from the frequency of snapshots released last week, but still had a good amount of releases this week.
After continuous daily releases from Oct. 27 to Nov. 2, openSUSE Tumbleweed put together another three consecutive snapshots.
Snapshot 20211106 was an extremely large snapshot and brought software updates from GNOME, KDE, Mozilla and more. An update of gnome-software 41.1 brought various minor User Interface tweaks and fixes. The package improved metadata support for snaps and added the new GNOME Circle apps to the featured carousel. The 41.1 version of gnome-shell fixed some crashes and some erratic scrolling in GTK apps. KDE Gear 21.08.3 brought several fixes for Kdenlive. The video editor fixed the muting of audio, some resize and alignment issues and the behavior of incorrect wipe and slide transitions while resizing. KDE’s document viewer Okular fixed bookmark menu actions that were missing after switching tabs and Konqi fans who like to book travel have support for German Eurowings booking confirmation in the KItinerary package. Mozilla Thunderbird 91.3.0 fixed eight Common Vulnerabilities and Exposures. One of the CVE fixes for the email client involved disabling the Opportunistic Encryption feature because a network attacker could forward a connection from the browser to port 443 to port 8443. The disabled feature could cause the email browser to treat the content of port 8443 as the same-origin with HTTP. The Application Programming Interfaces with the gawk 5.1.1 update now handles Multiple Precision Floating-Point Reliable Library and GNU Multiple Precision Arithmetic Library values slightly differently, which requires different memory management for those values. The 1.2.4 update of PackageKit improved the thread safety of an operation cancellation and added a specific error code when a user declines an interaction. There were a few updates for YaST packages like yast2-network 4.4.29, which fixed a crash when checking if a virtual interface is connected. Other packages to update in the snapshot were evolution-ews 3.42.1, glib2 2.70.1, libvirt 7.9.0 and many other packages.
Just four packages arrived in snapshot 20211105 snapshot. The first of the 41.1 GNOME packages arrived in the snapshot. gnome-chess and gnome-remote-desktop. The latter had some adjustments for frame PipeWire data. There was some clean up with the network configuration package wicked in the 0.6.67 version along with changes in the dbus configuration. The aws-cli 1.21.6 package had multiple API changes and relaxed a version dependency for python-docutils.
Snapshot 20211104 brought more than a dozen updated packages. The removal of duplicated config entries and the construct of the snippets based on the main config were made with busybox 1.34.1. ClamAV 0.103.4 added virus-name suffixes to the alerts, which trigger when a scan limit has been exceeded, and the anti-virus package fixed some issues related to email parsing. The Chinese manual pages were updated with the man-pages-zh_CN 1.6.3.6 update and several pypi packages where updated including python-Pillow 8.4.0, python-boto3 1.19.6 and major version python-pyOpenSSL 21.0.0.
Survey Results of Packagers, Maintainers Posted
The openSUSE Project has posted results from a recent survey that ran between Oct. 7 and Oct. 29.
The aim was to gather more information from open-source developers, development teams, packagers and maintainers. The survey also aimed to determine the satisfaction level of contributors and better understand the complexities and challenges they encounter with the project’s development. The survey provided an area to comment and provide suggestions to improve relevant aspects of the project and its tools.
An email to the factory mailing list about the results has provided fun discussions. The highest majority of people submitting the survey were between the ages of 35 and 49. Almost 90 percent were from the northern hemisphere and almost 60 percent had a university degree. A vast majority had or are working in the Information Technology field. On average, maintainers and packagers interact with 11.34 people for their development projects.
More information about the results can be found on the openSUSE wiki.
Sequence – making PatternDB creation for syslog-ng easier
Sequence – making PatternDB creation for syslog-ng easier
We are well into the 21st century, but most of the log messages still arrive in an unstructured format. For well over a decade, syslog-ng had a solution to turn unstructured messages into name-value pairs, called PatternDB. However, creating a pattern database for PatternDB from scratch is a source of major pain. Or rather, it was: sequence-rtg – a fork of the sequence log analyzer – provides a new hope! It can easily create ready-to-use patterns for your most frequent log messages.
Sequence-rtg is still in beta phase, and therefore is a bit rough around the edges. However, once you deal with the initial struggles of creating the database, it works just fine. Especially if you have lots of log messages. My experience was that the more log messages and larger batch sizes I had, the better quality patterns were generated.
Read my blog at https://www.syslog-ng.com/community/b/blog/posts/sequence-making-patterndb-creation-for-syslog-ng-easier