
 Member
 DimStar
openSUSE Tumbleweed – Review of the week 2020/08
Dear Tumbleweed users and hackers,
After a week of hacking on different stuff and being in the background for Tumbleweed while Oliver took on the role of Release Manager, I am back with you. And we have released three snapshots this week (0214, 0218 and 0219). The gap between 0214 and 0218 was the integration of glibc 2.31. But of course, there was more happening this week. So here comes the list:
- glibc 2.31
- Mozilla Firefox 73.0
- KDE Frameworks 5.67.0
- Linux kernel 5.5.4
- PostgreSQL 12.2
- MicroOS Desktops are available as part of the MicroOS DVD installer
Things you can expect come to a snapshot in the (hopefully not too far) future:
- zsh 5.8 (Snapshot 0220+)
- libcap 2.30 (snapshot 0221+)
- GNOME 3.34.4
- llvm 6 will be removed from the repository
- Linux kernel 5.5.5
- KDE Plasma 5.18.1
- Ruby 2.7 – possibly paired with the removal of Ruby 2.6
- GCC 10
- Python 3.8 (unchanged, awaiting the fix for salt)
- Removal of Python 2
- GNU Make 4.3
- RPM: change of database format to ndb

Plasma, NodeJS, pip, Grep update in Tumbleweed
Three openSUSE Tumbleweed snapshots arrived this week and the snapshots provided a few major version upgrades and several minor updates with newer features.
The latest snapshot was 20200218. This snapshot updated a subpackage for btrfsprogs to version 5.4.1 and fixes the docbook5 builds. The Linux Kernel updated to 5.5.4 and had a few changes for KVM on arm64. The update of glibc 2.31 now supports a feature test macro [_ISOC2X_SOURCE](https://gitlab.com/freedesktop-sdk/mirrors/sourceware/glibc/-/commit/777d75fbc07b98115f4868c3290eb8a5d1f3a5b2) to enable features from the draft ISO C2X standard. Command line utility grep 3.4 fixed some performance bugs and adds a new –no-ignore-case option that causes grep to observe case distinctions, overriding any previous -i (–ignore-case) option. The DBus-activated daemon controlling mobile devices and connections, ModemManager fixed the handling of hexadecimal 0x00 bytes at the end of GSM encoded strings in version 1.12.6. There were several other packages updated in the snapshot. Among the packages to be updated were flatpak 1.6.2, GNOME’s web browser epiphany 3.34.4, email client mutt 1.13.4, strace 5.5, sudo 1.8.31 and whois 5.5.5. With less than a week to go until a rating is finalized, a rating of 92 was initially released for the snapshot, according to the snapshot reviewer.
Snapshot 20200214 updated both Mozilla Firefox and Thunderbird to versions 73.0 and 68.5 respectively. The new major version of the browser addressed six Common Vulnerabilities and Exposures (CVE) that included one bug fix that affected the memory. The new release includes new features that help users view and read website content more easily by enhancing the page zoom feature. The version also added NextDNS as an alternative option for DNS over HTTPS. The Thunderbird email client addressed seven CVEs and added support for client Identity IMAP/SMTP Service Extension and for OAuth 2.0 authentication for POP3 accounts. KDE users had multiple package updates from Plasma Framework 5.67.0; Kirigami removed the header top margin from private ScrollView and properly expanded the fillWidth items in mobile mode. The KTextEditor fixed the drag and copy function, and the framework’s package also fixed a crash in the variable expansion with the use of external tools. The package for the JavaScript runtime environment, nodejs12 updated to version 12.16.0 added a new core module for a WebAssebly System Interface as an experimental feature. The NodeJS version also added Hash.prototype.copy making it possible to clone an internal state of Hash object. Text editor nano 4.8 improved the handling of lock files on start-up. Two other major version updates in the snapshot were python-packaging 20.1 and python-pip 20.0.2; the new pip version switches to a dedicated command-line interface tool for vendoring dependencies and the changelog points out that the wheel cache is not retro-compatible with previous versions and that pip will continue to take advantage of existing legacy cache entries until pip 21.0 is released. Version control tool mercurial 5.3 fixed some bugs and added a new Large File Storage experimental feature. The utilities package for controlling TCP / IP networking and traffic control in Linux, iproute2, updated to version 5.5.0, which added four patches and a new timestamp format. Other packages that updated in the snapshot were babl 0.1.74, ccache 3.7.7 and gegl 0.4.20. The snapshot is currently trending moderately stable at a rating of 80, according to the Tumbleweed snapshot reviewer.
A little more than half a dozen packages were updated in snapshot 20200213. The interactive Python accessibility explorer package accerciser 3.34.4 updated translations and documented a new python-xlib dependency. The update elfutils 0.178 package fixed variable references in specfile and added a RISC-V disassembler. Windows Server 2019 support was added with the update of vm-install 0.10.08. The snapshot recorded a moderately stable rating of 75, according to the Tumbleweed snapshot reviewer.
The previous week’s 20200211 snapshot recorded a rating of 71 and brought KDE’s plasma5-desktop 5.18.0, which will be the version in openSUSE Leap 15.2 when it’s released. The new Plasma 5.18 Long Term Support (LTS) is even more user-friendly and filled with more features. The new Emoji Selector is just two keystrokes away. Hold down the Meta key and press the period (.) and it will pop up. The version also provides a new Night Color feature to relax users eyesight. KDE Applications was also updated in the snapshot. The 19.12.2 version update provided a big release of KDevelop 5.5, which is the Integrated Development Environment (IDE) that makes writing programs in C++, Python and PHP easier. . PHP gets PHP 7.4’s typed properties and support was added for array of type and class constant visibility. In Python, support was added for Python 3.8.

It is time for a war on tabs

We (as a UI shell project) see the limits of our territory as the window, when there is the assumption nowadays that MDI tabbed interfaces are where most significant user activity takes place. Yet interacting with different views/documents within those windows is not standardised, so the user has to remember which app they are using, then select the appropriate actions to:
- recognise the current tab
- switch tabs
- move tabs in the current window or between windows
- notice which tab is being switched to (different switcher UIs, not shown)
- open/close tabs
- be warned when closing a window with multiple tabs
- use keyboard shortcuts to switch tabs
- persist tabs between logins
- share sets of tabs between devices
I'm not saying Plasma needs to become a tabbed window manager, but we can do better, and it is definitely time to declare war on the mess above.

oSLO Conference 🐧
oSLO is short for openSUSE + LibreOffice.
The two projects are celebrating their 15ᵗʰ and 10ᵗʰ anniversary respectively in 2020. To mark the occasion, openSUSE and LibreOffice projects are organizing a joint conference from 13ᵗʰ to 16ᵗʰ October 2020 in Nuremberg, Germany. The conference will take place at Z-bau (Frankenstraße 200). It is the same location where last year's openSUSE Conference was held.
openSUSE and LibreOffice conferences are meant to bring like minded people together to discuss about topics relative to the projects. People can learn, teach and share their passion about the projects.
Last September, openSUSE announced a logo design competition for this co-conference with LibreOffice. Early this month the winner of the competition was announced. Kukuh Syafaat from Indonesia won the hearts of the co-conference organizing team.

The conference is free to attend. Mark you calendar & join the fun!
Call for Papers
The organizing team is currently accepting proposals for sessions. The deadline for submission is 21 July 2020.
openSUSE Tumbleweed – Review of the week 2020/07
Dear Tumbleweed users and hackers,
At SUSE we had so-called hackweek. Meaning everybody could do something out of their regular tasks and work for a week on something else they wish to invest time on. I used the time to finally get the ‘osc collab’ server back in shape (Migrated from SLE11SP4 to Leap 15.1) – And in turn handed ‘The Tumbleweed Release Manager hat’ over to Oliver Kurz, who expressed an interest in learning about the release Process for Tumbleweed. I think it was an interesting experiment for both of us: for him, to get something different done and for me to get some interesting questions as to why things are the way they are. Obviously, a fresh look from the outside gives some interesting questions and a few things translated in code changes on the tools in use (nothing major, but I’m sure discussions will go on)
As I stepped mostly back this week and handed RM tasks over to Oliver, that also means he will be posting the ‘Review of the week’ to the opensusefactory mailing list. For my fellow blog users, I will include it here directly for your reference.
What was happening this week and included in the published snapshots:
* KDE Applications 19.12.2
* KDE Plasma 5.18
* Linux Kernel 5.5.1 (which as some times in before posed a problem for owners
of NVIDIA cards running proprietary drivers when Tumbleweed is too fast and
drivers are not yet provided by NVIDIA in time for the new kernel version)²
What is still ongoing or in the process in stagings:
* Python 3.8 (salt, still brewing but progressing)
* Removal of python 2 (in multiple packages)
* glibc 2.31 (good progress but not done)
* GNU make 4.3
* libcap 2.30: breaks fakeroot and drpm
* RPM: change of the database format to ndb
* MicroOS Desktop³
Have fun,
Oliver
Call for Papers, Registration Opens for openSUSE + LibreOffice Conference
Planning for the openSUSE + LibreOffice Conference has begun and members of the open-source communities can now register for the conference. The Call for Papers is open and people can submit their talks until July 21.
The following tracks can be selected when submitting talks related to openSUSE:
-
a) openSUSE
-
b) Open Source
-
c) Cloud and Containers
-
d) Embedded.
The following tracks can be selected when submitting talks related to LibreOffice:
-
a) Development, APIs, Extensions, Future Technology
-
b) Quality Assurance
-
c) Localization, Documentation and Native Language Projects
-
d) Appealing Libreoffice: Ease of Use, Design and Accessibility
-
e) Open Document Format, Document Liberation and Interoperability
-
f) Advocating, Promoting, Marketing LibreOffice
Talks can range from easy to difficult and there are 15 minute, 30 minute and 45 minute slots available. Workshops and workgroup sessions are also available and are planned to take place on the first day of the conference.
Both openSUSE and LibreOffice are combining their conferences (openSUSE Conference and LibOcon) in 2020 to celebrate LibreOffice’s 10-year anniversary and openSUSE’s 15-year anniversary. The conference will take place in Nuremberg, Germany, at the Z-Bau from Oct. 13 to 16.
How to submit a proposal
Please submit your proposal to the following website: https://events.opensuse.org/conferences/oSLO
-
Create an account if you don’t already have one.
-
Your proposal must be written in English and be no longer than 500 words.
-
Please run spell and grammar checkers for your proposal before submission.
-
Your biography on your profile page is also a reviewed document. Please do not forget to write your background.
-
You must obey openSUSE Conference code of conduct: https://en.opensuse.org/openSUSE:Conference_code_of_conduct
-
It is recommended that you use the slide deck of what ever organization you choose to represent. The openSUSE slide decks are located at https://github.com/openSUSE/artwork/tree/master/slides and the LibreOffice slide deck is located at https://extensions.libreoffice.org/templates/libreoffice-presentation-templates
Guide to write your proposal
Please write your proposal so that it is related to one or more topics. For example, if your talk is on security or desktop, it is better that it contains how to install that applications or demo on openSUSE. Please clarify what the participants will learn from your talk.
-
The introduction of main technology or software in your talk
-
The main topic of your talk
Only workshop: please write how to use your time and what you need.
-
We recommend writing a simple timetable on your proposal
-
Please write the necessary equipment (laptops, internet access) to the Requirement field
Travel Support
The speakers are eligible to receive sponsorship from either the openSUSE Travel Support Program (TSP) or the LibreOffice’s Travel Policy process. Those who wish to use travel support should request the support well in advance. The last possible date to submit a request from openSUSE’s TSP is Sept. 1.
- Please refer to the following URL for how to apply for travel support: https://en.opensuse.org/openSUSE:Travel_Support_Program
Visa
For citizens who are not a citizen of a Schengen country in Europe, you may need a formal invitation letter that fully explains the nature of your visit. An overview of visa requirements/exemptions for entry into the Federal Republic of Germany can be found at the Federal Foreign Office website. If you fall into one of the categories requiring an invitation letter, please email ddemaio (@) opensuse.org with the email subject “openSUSE + LibreOffice Conference Visa”.
Other requirements for a visa state you must:
-
Have a valid passport
-
Have enough money for each day of their stay)
-
Be able to demonstrate the purpose of your stay to border officials
-
Pose no threat to public order, national security or international relations
People of openSUSE: An Interview with Ish Sookun
Can you tell us a bit about yourself?
I live on an island in the middle of the Indian Ocean (20°2’ S, 57°6’ E), called Mauritius. I work for a company that supports me in contributing to the openSUSE Project. That being said, we also heavily use openSUSE at the workplace.
Tell us about your early interaction with computers ? How your journey with Linux got started?
My early interaction with computers only started in the late years of college and I picked up Linux after a few students who were attending the computer classes back then whispered the term “Linux” as a super complicated thing. It caught my attention and I got hooked ever since. I had a few years of distro hopping until in 2009 I settled down with openSUSE.
Can you tell us more about your participation in openSUSE and why it started?
I joined the “Ambassador” program in 2009, which later was renamed to openSUSE Advocate, and finally the program was dropped. In 2013, I joined the openSUSE Local Coordinators to help coordinating activities in the region. It was my way of contributing back. During those years, I would also test openSUSE RCs and report bugs, organize local meetups about Linux in general (some times openSUSE in particular) and blog about those activities. Then, in 2018 after an inspiring conversation with Richard Brown, while he was the openSUSE Chairman, I stepped up and joined the openSUSE Elections Committee, to volunteer in election tasks. It was a nice and enriching learning experience along with my fellow election officials back then, Gerry Makaro and Edwin Zakaria. I attended my first openSUSE Conference in May 2019 in Nuremberg. I did a presentation on how we’re using Podman in production in my workplace. I was extremely nervous to give this first talk in front of the openSUSE community but I met folks who cheered me up. I can’t forget the encouragement from Richard, Gertjan, Harris, Doug, Marina and the countless friends I made at the conference. Later during the conference, I was back on the stage, during the Lightning Talks, and I spoke while holding the openSUSE beer in one hand and the microphone in the other. Nervousness was all gone thanks to the magic of the community.
Edwin and Ary told me about their activities in Indonesia, particularly about the openSUSE Asia Summit. When the CfP for oSAS 2019 was opened, I did not hesitate to submit a talk, which was accepted, and months later I stood among some awesome openSUSE contributors in Bali, Indonesia. It was a great Summit where I discovered more of the openSUSE community. I met Gerald Pfeifer, the new chairman of openSUSE, and we talked about yoga, surrounded by all of the geeko fun, talks and workshops happening.
Back to your question, to answer the second part about “why openSUSE”, I can safely, gladly and proudly say that openSUSE was (and still is) the most welcoming community and easiest project to start contributing to.
Tea or coffee?
Black coffee w/o sugar please.
Can you describe us the work of the Election Committee ? What challenges is it facing when elections time comes?
An election official should be familiar with the election rules. These help us plan an election and set the duration for every phase. The planning phase is crucial and it requires the officials to consult each other often. Some times being in time zones that are hours apart it is not obvious to hold long hours chats. We then rely on threaded emails that then takes more time to reach consensus on a matter. The election process becomes challenging if members do not step up for board candidacy as the deadline approaches. When the election begins, the next challenge is to not miss out any member. We make sure that we obtain an up-to-date list of openSUSE members and that they receive their voter link/credentials. We attend to requests from members having issues finding the email containing their voter link. Very often it ends up being something trivial as members using two different email addresses; one on the mailing list and a different one in their openSUSE Connect account.
I call these challenges to address the question but in reality it’s fun to be part of all this and ensure everything runs smoothly. Gerry has set a good example in the 2018-2019 Board election, which we still follow. Edwin has been extremely supportive in the three elections where we worked together. Recently joined, Ariez Vachha has proven to be a great addition to the team.
What do you like the most about being involved in the community?
The people.
What is one feature, project, that you think needs more attention in openSUSE?
Documentation.
What side projects/hobbies you work on outside of openSUSE?
I experiment with containers using Podman. It’s a fairly recent love but it keeps me busy. Community-wise, I like to attend local meetups, events and blog about those activities. I often help with the planning or any other task within my capacity for the Developers Conference of Mauritius. It’s a yearly event that brings the local geeks together for three days of fun. Luckily I have a supportive wife who bears with the geek tantrums and she volunteers in some of the community activities too. Oh, I might get kicked if I do not mention and give her credit for the openSUSE Goodies packs she prepares for my local talks.
What is your desktop environment of choice / preferred desktop setup?
GNOME until recently. I switched to KDE after my developer colleagues would not stop bragging about how good their KDE environment is and my GNOME/Wayland environment started acting weird.
What is your favorite food?
Paneer Makhani (Indian cottage cheese in spicy curry gravy).
What do you think the future holds for the openSUSE project?
With the example set by the openSUSE Asia community, I think the future of the project is having a strong openSUSE presence on every habitable continent.
Any final thoughts or message to our readers?
Let’s paint the world green!
Do you CI?
When I ask ask people about their approach to continuous integration, I often hear a response like
“yes of course, we have CI, we use…”.
When I ask people about doing continuous integration I often hear “that wouldn’t work for us…”
It seems the practice of continuous integration is still quite extreme. It’s hard, takes time, requires skill, discipline and humility.
What is CI?
Continuous integration is often confused with build tooling & automation. CI is not something you have, it’s something you do.
Continuous integration is about continually integrating. Regularly (several times a day) integrating your changes (in small & safe chunks) with the changes being made by everyone else working on the same system.
Teams often think they are doing continuous integration, but are using feature branches that live for hours or even days to weeks.
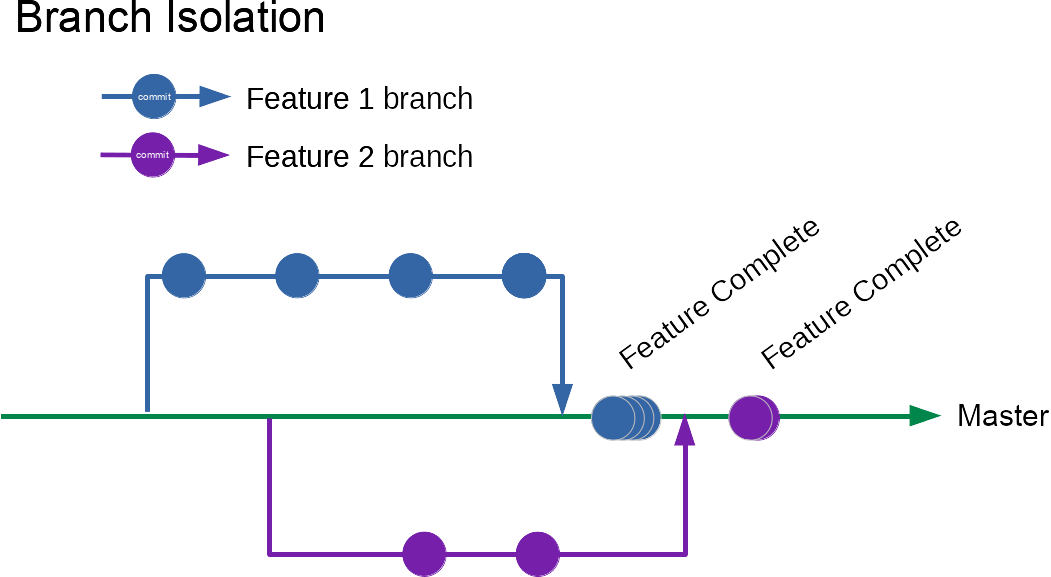
Code branches that live for much more than an hour are an indication you’re not continually integrating. You’re using branches to maintain some degree of isolation from the work done by the rest of the team.
I like the current Wikipedia definition: “continuous integration (CI) is the practice of merging all developer working copies to a shared mainline several times a day.”
I like this description. It’s worth calling out a few bits.
CI is a practice. Something you do, not something you have. You might have “CI Tooling”. Automated build/test running tooling that helps check all changes.
Such tooling is good and helpful, but having it doesn’t mean you’re continually integrating.
Often the same tooling is even used to make it easier to develop code in isolation from others. The opposite of continuous integration.
I don’t mean to imply that developing in isolation and using the tooling this way is bad. It may be the best option in context. Long lived branches and asynchronous tooling has enabled collaboration amongst large groups of people across distributed geographies and timezones.
CI is a different way of working. Automated build and test tooling may be a near universal good. (even a hygiene factor). The practice of Continuous Integration is very helpful in some contexts, even if less universally beneficial.
…all developer working copies…
All developers on the team integrating their code. Not just small changes. If bigger features are worked on in isolation for days or until they’re complete you’re not integrating continuously.
…to a shared mainline…
Code is integrated into the same branch. Often “master” in git parlance. It’s not just about everyone pushing their code to be checked by a central service. It’s about knowing it works when combined with everyone else’s work in progress, and visible to the rest of the team.
…several times a day
This is perhaps the most extreme part. The part that highlights just how unusual a practice continuous integration really is. Despite everyone talking about it.
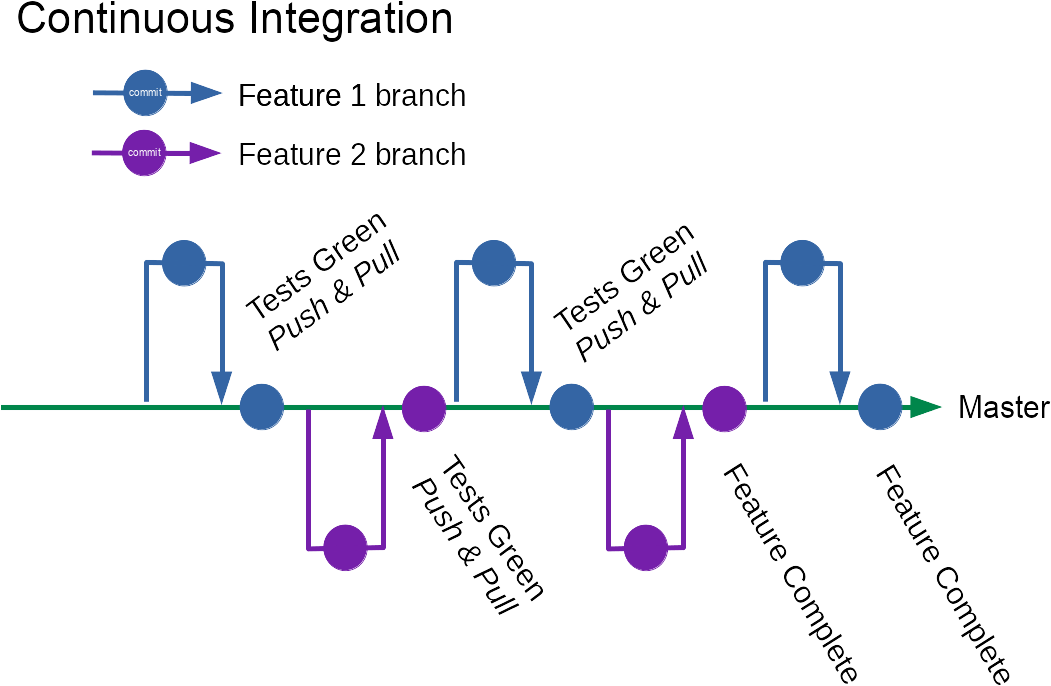
Imagine you’re in a team of five developers, working independently, practising CI. Aiming to integrate your changes roughly once an hour. You might see 40 commits to master in a single day. Each commit representing a functional, working, potentially releasable state of the system.
(Teams I’ve worked on haven’t seen quite such a high commit rate. It’s reduced by pairing and non-coding work; nonetheless CI means high rate of commits to the mainline branch)
Working in this way is hard, requires a lot of discipline and skill. It might seem impossible to make large scale changes this way at first glance. It’s not surprising it’s uncommon.
To visualise the difference
Why CI?
Get Feedback
Why would work work in such a way? Integrating our changes will incur some overhead. It likely means taking time out every single hour to review changes so far, tidy, merge, and deal with any conflicts arising.
Continuously integrating helps us get feedback as fast as possible. Like most Extreme Programming practices. It’s worth practising CI if that feedback is more valuable to you than the overhead.
Team mates
We may get feedback from other team members—who will see our code early when they pull it. Maybe they have ideas for doing things better. Maybe they’ll spot a conflict or an opportunity from their knowledge and perspective. Maybe you’ve both thought to refactor something in subtly different ways and the difference helps you gain a deeper insight into your domain.
Code
CI amplifies feedback from the code itself. Listening to this feedback can help us write more modular, supple code that’s easier to change.
If our very-small change conflicts with another working on a different feature it’s worth considering whether the code being changed has too many responsibilities. Why did it need to change to support both features? Modularity is promoted by CI creating micro-pain from multiple people changing the same thing at the same time.
Making a large-scale change to our system via small sub-hour changes forces us to take a tidy-first approach. Often the next change we want to make is hard, not possible in less than an hour. Instead of taking our preconceived path towards our preconceived design, we are pressured to first make the change we want to make easier. Improve the design of the existing code so that the change we want to make becomes simple.
Even with this approach we’re unlikely to be able to make large scale changes in a single step. CI encourages mechanisms for integrating the code for incomplete changes. Such as branch by abstraction which further encourages modularity.
CI also exerts pressure to do more and better
If our tests are brittle—coupled to the current structure of the code rather than the important behaviour then they will fail frequently when the code is changed. If our tests are slow then we’d waste lots of time running regularly, hopefully incentivising us to invest in speeding them up.
Continuous integration of small changes exposes us to this feedback regularly.
If we’re integrating hourly then this feedback is also timely. We can get feedback on our code structure and designs before it becomes expensive to change direction.
Production
CI is a useful foundation for continuous delivery, and continuous deployment. Having the code always in an integrated state that’s safe to release.
Continuously deploying (not the same as releasing) our changes to production enables feedback from customers, users, its impact on production health.
Combat Risk
Arguably the most significant benefit of CI is that it forces us to make our changes in small, safe, low-risk steps. Constant practice ensures it’s possible when it really matters.
It’s easy to approach a radical change to our system from the comforting isolation of a feature branch. We can start pulling things apart across the codebase and shaping them into our desired structure. Freed from the constraints of keeping tests passing or even our code compiling. Coming back to getting it working, the code compiling, and the tests compiling afterwards.
The problem with this approach is that it’s high risk. There’s a high risk that our change takes a lot longer than expected and we’ll have nothing to integrate for quite some time. There’s a high risk that we get to the end and discover unforeseen problems only at integration time. There’s a high risk that we introduce bugs that we don’t detect until after our entire change is complete. There’s a high risk that our product increment and commercial goals are missed because they are blocked by our big radical change. There’s a risk we feel pressured into rushing and sacrificing code quality when problems are only discovered late during an integration phase.
CI liberates us from these risks. Rather than embarking on a grand plan all at once, we break it down into small steps that we can complete and integrate swiftly. Steps that only take a few mins to complete.
Eventually the accumulation of these small changes unlock product capabilities and enable releasing value. Working in small steps becomes predictable. No longer is there a big delay from “we’ve got this working” to “this is ready for release”
This does not require us to be certain of our eventual goal and design. Quite the opposite. We start with a small step towards our expected goal. When we find something hard, hard to change then we stop and change tack. First making a small refactoring to try and make our originally intended change easy to make. Once we’ve made it easy we can go back and make the actual change.
What if we realise we’re going in the wrong direction? Well we’ve refactored our code to make it easier to change. What if we’ve made our codebase better for no reason? We’ve still won.
Collaborate Effectively
Meetings are not always popular. Especially ceremonies such as standups. Nevertheless it’s important for a team of people working towards a common goal to understand where each other have got to. To be able to react to new information, change direction if necessary, help each other out.
The more we work separately in isolation, the more costly and painful synchronisation points like standups can become. Catching each other up on big changes in order to know whether to adjust the plan.
Contrast this with everyone working in small, easy to digest steps. Making their progress visible to everyone else on the team frequently. It’s more likely that everyone already has a good idea of where the rest of the team is at and less time must be spent catching up. When everyone on the team is aware of where everyone else has got to the team can actually work as team. Helping each other out to speed a goal.
No-one likes endless discussions that get in the way of making progress. No-one likes costly re-work when they discover their approach conflicts with other work in the team. No-one likes wasting time duplicating work. CI enables constant progress of the whole team, at a rate the whole team can keep up with.
Arguably the most extreme continuous integration is mob programming. The whole team working on the same thing, at the same time, all the time.
Obstacles
“but we’re making a large scale change”
We touched on this above. It’s usually possible to make a large scale change via small, safe, steps. First making the change easier, then making the change. Developing new functionality side by side in the same codebase until we’re satisfied it can replace older functionality.
Indeed the discipline required to make changes this way can be a positive influence on code quality.
“but code review”
Many teams have a process of blocking code review prior to integrating changes into a mainline branch. If this code review requires interrupting someone else every few minutes this may be impractical.
Continuous integration like requires being comfortable with changes being integrated without such a blocking pull-request review style gate.
It’s worth asking yourself why you do such review and whether a blocking approach is the only way. There are alternatives that may even achieve better results.
Pair programming means all code is reviewed at the point in time it was written. It also gives the most timely feedback from someone else who fully understands the context. Pairing tends to generate feedback that improves the code quality. Asynchronous reviews all too often focus on whether the code meets some arbitrary bar—focusing on minutiae such as coding style and the contents of the diff, rather than the implications of the change on our understanding of the whole system.
Pair programming doesn’t necessarily give all the benefits of a code review. It may be beneficial for more people to be aware of each change, and to gain the perspective of people who are fresher or more detached. This can be achieved to a large extent by rotating people through pairs, but review may still be useful.
Another mechanism is non-blocking code review. Treating code review more like a retrospective. Rather than “is this code good enough to be merged” ask “what can we learn from this change, and what can we do better?”.
Consider starting each day reviewing as a team the changes made the previous day and what you can learn from them. Or stopping and reviewing recent changes when rotating who you are pair-programming with. Or having a team retrospective session where you read code together and share ideas for different approaches.
“but master will be imperfect”
Continuous integration implies master is always in an imperfect state. There will be incomplete features. There may be code that would have been blocked by a code review. This may seem uncomfortable if you strive to maintain a clean mainline that the whole team is happy with and is “complete”.
Imperfection in master is scary if you’re used to master representing the final state of code. Once it’s there being unlikely to change any time soon. In such a context being protective of it is a sensible response. We want to avoid mistakes we might need to live with for a long time.
However, an imperfect master is less of a problem in a CI context. What is the cost of a coding style violation that only lives for a few hours? What is the cost of temporary scaffolding (such as a branch by abstraction) living in the codebase for a few days?
CI suggests instead a habitable master branch. A workspace that’s being actively worked in. It’s not clinically clean, it’s a safe and useful environment to get work done in. An environment you’re comfortable spending lots of time in. How clean a workspace needs to be depends on the context. Compare a gardeners or plumbers’ work environment to a medical work environment.
“but how will we test it?”
Some teams separate the activities of software development from software testing. One pattern is testing features when each feature is complete, during an integration and stabilisation phase.
This allows teams to maintain a master branch that they think works, with uncertain work in progress in isolation.
However thorough our automated, manual, and exploratory testing we’re never going to have perfect software quality. Integration-testing might be a pattern to ensure integrated code meets some arbitrary quality bar but it won’t be perfect.
CI implies a different approach. Continuous exploratory testing of the master version. Continually improving our understanding of the current state of the system. Continuously improving it as our understanding improves. Combine this with TDD and high levels of automated checks and we can have some confidence that each micro change we integrate works as intended.
Again, this sort of approach requires being comfortable with master being imperfect. Or perhaps a recognition that it is always going to be imperfect, whatever we do.
“but we need to be able to do bugfixes”
Many teams work in batches. Deploying and releasing one set of features, working on more features in feature branches, then integrating, deploying, and releasing the next batch.
Under this model they can keep a branch that represents the current deployed version of the software. When an urgent bug is discovered in production they can fix it on this branch and deploy just that change.
From such a position the prospect of making a bugfix on top of a bunch of other already integrated changes might seem alarming. What if one of our other changes causes a regression.
CI is a fundamentally different way of working. Where our current state of master always captures the team’s current understanding of the most progressed, safest, least buggy system. Always deployable. Zero-bugs (bugs fixed when they’re discovered). Constantly evolving through small, safe steps.
A good way to make it safe to deploy bugfixes in a CI context is to also practise continuous deployment. Every micro-change deployed to production (not necessarily released). Doing this we’ll always have confidence we can deploy fixes rapidly. We’re forced to ensure that master is always safe for bugfixes.
“but…”
There’s also plenty of circumstances in which CI is not feasible or not the right approach for you. Maybe you’re the only developer! Occasional integration works well for sporadic collaboration between people with spare time open source contributions. For teams distributed across wide timezones there’s less benefits to CI. You’re not going to get fast feedback while your colleague is asleep! You can still work in and benefit from small steps regardless of whether anyone is watching.
Sometimes feedback is less important than hammering out code. If you’re working on something that you could do in your sleep and all that holds you back is how fast you can hammer out lines of code. The value of CI is much less.
Perhaps your team is very used to working with long lived branches. Used to having the code/tests broken for extended periods while working on a problem. It’s not feasible to “just” switch to a continuous integration style. You need to get used to working in small, safe, steps.
How…
Try it
Make “could we integrate what we’ve done” a question you ask yourself habitually. It fits naturally into the TDD cycle. When the tests are green consider integration. It should be safe.
Listen to the feedback
Listen to the feedback. Ok, you tried integrating more frequently and something broke, or things were slower. Why was that really? How could you avoid similar problems occurring while still being able to integrate regularly?
Tips when it’s hard
Combine with other Extreme Programming practices.
CI is easier with other Extreme Programming practices, not just TDD—which makes it safer and lends a useful cadence to development .
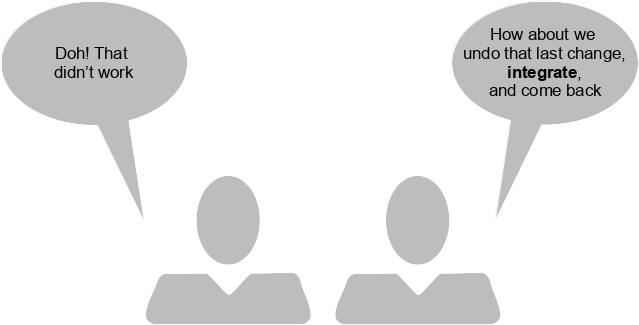
It’s easier when pair programming. Someone else helping remember the wider context. Someone to suggest stepping back and integrating a smaller set before going down a rabbit hole. Pairing also helps our chances of each change being safe to make. It’s more likely that others on the team will be happy with our change if our pair is on board.
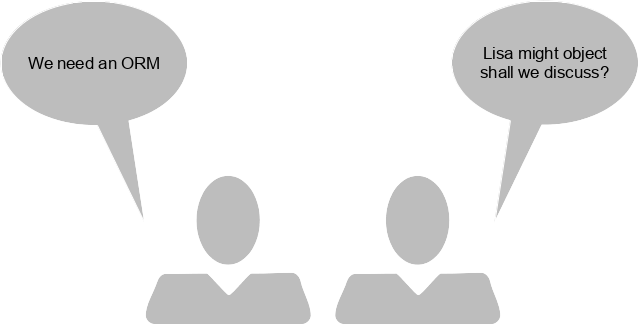
CI is a lot easier with collective ownership. Where you are free to change any part of the codebase to make your desired change easy.
When your change is hard to do in small steps, first tackle one thing that makes it hard. “First make the change easy”
Separate expanding and contracting. Start building your new functionality in several steps alongside the old, then migrate existing usages, then finally remove the old. This can be done in several steps.
Separate integrating and releasing. Integrating your code should not mean that the code necessarily affects your users. Make releasing a product/business decision with feature toggles.
Invest in fast tooling. If your build and test suite takes more than 5 minutes you’re going to struggle to do continuous integration. A 5 min build and test run is feasible even with tens of thousands of tests. However, it does require constant investment in keeping the tooling fast. This is a cost of CI, but it’s also a benefit. CI requires you to keep the tooling you need to safely integrate and release a change fast and reliable. Something you’ll be thankful for when you need to make a change fast.
That’s a lot of work…
Unlike having CI [tooling], doing CI is not for all teams. It seems uncommonly practised. In some contexts it’s impractical. In others it’s not worth the overhead. Maybe worth considering whether the feedback and risk reduction would help your team.
If you’re not doing CI and you try it out, things will likely be hard. You may break things. Try to reflect deeper than “we tried it and it didn’t work”. What made it hard to work in and integrate small changes? Should you address those things regardless?
The post Do you CI? appeared first on Benji's Blog.

Regular Release Distributions Are Wrong
For those who don’t already know, openSUSE is a Linux Distribution Project with two Linux distributions, Tumbleweed and Leap.
- Tumbleweed is what is known as a Rolling Release, in that the distribution is constantly updating. Unlike Operating Systems with specific versions (e.g.. Windows 7, Windows 10, iOS 13, etc..) there is just ‘openSUSE Tumbleweed’ and anyone downloading it fresh or updating it today gets all the latest software.
- Leap is what is known as a a Regular Release, in that it does have specific versions (e.g.. 15.0, 15.1, 15.2) released in a regular cadence. In Leap’s case, this is annually. Leap is a variation of the Regular Release known as an LTS Release because each of those ‘minor versions’ (X.1, .2, .3) are intended to include only minor changes, with a major new version (e.g.. 16.0) expected only every few years.
It’s a long documented fact that I am a big proponent of Rolling Releases and use them as my main operating system for Work & Play on my Desktops/Laptops.
However in the 4 years since writing that last blog post I always had a number of Leap machines in my life, mostly running as servers.
As of today, my last Leap machine is no more, and I do not foresee ever going back to Leap or any Linux distribution like it.
This post seeks to answer why I have fallen out of love with the Regular Release approach to developing & using Operating Systems and provide an introduction to how you too could rely on Rolling Releases (specifically Tumbleweed & MicroOS) for everything.
Disclaimer
First, a few disclaimers apply to this post. I fully realise that I am expressing a somewhat controversial point and am utterly expecting some people to disagree and be dismissive of my point of view. That’s fine, we’re all entitled to our opinions, this post is mine.
I am also distinctly aware that, my views expressed run counter to the business decisions of the customers of my employer, who do a very good job of selling a very commercially successful Enterprise Regular Release distribution.
The views expressed here are my own and not those of my employer.
And I have no problem that my employer is doing a very good job making a lot of money from customers who are currently making decisions I feel are ‘wrong’.
If my opinion is correct then I hope I can help my employer make even more money when customers start making decisions I feel are more ‘right’.
Regular & LTS Releases Mean Well
Regular & LTS Releases (hereafter referred to as just Regular Releases) have all of the best intentions. The Open Source world is made up of thousands if not millions of discreet Free Software & Open Source Projects, and Linux distributions exist to take all of that often chaotic, ever-evolving software and condensing it into a consumable format that is then put to very real work by its users. This might be something as ‘simple’ as a single Desktop or Server Computer, or something far larger and complex such as a SystemZ Mainframe or 100+ node Kubernetes Cluster.
The traditional mindset for distribution builders is that the regular release gives a nice, predictable, plan-able schedule in which the team can carefully select appropriate software from the various upstream projects.
This software can then be carefully curated, integrated, and maintained for several, sometimes many, years.
This maintenance often comes in the form of making minimal changes, seeking only to address specific security issues or customer requests, taking great care not to break systems currently in use.
This mindset is often appreciated by users, who also want from their computing a nice, predictable, reliable experience.. but they also want new stuff to keep up with their peers, either in communities or commercially.. and here begins the first problem.
All Change Is Dangerous, but Small Changes Can Be Worse
Firstly, whether the change is a security update or a new feature, that change is going to be made by humans. Humans are flawed, and no matter how great we all get with fancy release processes and automated testing, we will never avoid the fact that humans make mistakes.
Therefore, the nature of the change has to be looked at. “Is this change too risky?” is a common question, and quite often highly desired features take years to deliver in regular releases because the answer is “yes”.
When changes are made, they are made with the intention of minimising the risks introduced by changing the existing software. That often means avoiding updating software to an entirely new version but instead opting to backport the smallest necessary amounts of code and merging them with (often much) older versions already in the Regular Release. We call these patches, or updates, or maintenance updates, but we avoid referring them to what they really are … franken-software

No matter how skilled the engineers are doing it, no matter how great the processes & testing are around their backporting, fundamentally the result is a hybrid mixed together combination of old and new software which was never originally intended to work together.
In the process of trying to avoid risk, backports instead introduce entirely new vectors for bugs to appear.
Regular Releases Neglect The Strengths Of Open Source
Linus’s Law states “given enough eyeballs, all bugs are shallow.”
I believe this to be a fundamental truth and one of the strongest benefits of the Open Source development model. The more people involved in working on something, the more eyeballs looking at the code, the better that code is, not just in a ‘lack of bugs’ sense but also often in a ‘number of working features’ sense.
And yet the process of building Regular Releases actively avoids this benefit. The large swath of contributors in various upstream projects are familiar with codebases often months, if not years, ahead of the versions used in Regular Releases.
Even inside Community Distribution Projects, it is my experience that the vast majority of volunteer distribution developers are more enthused in targetting ‘the next release’ rather than backporting complex features into an old codebase months or years old.
This leaves a small handful of committed volunteers, and those employees of companies selling commercial regular releases. These limited resources are often siloed, with only time and resources to work on their specific distribution, with their backports and patches often hard to reuse by other communities.
With Regular Releases, there are not many eyes. Does that mean all bugs are deep?
I am not suggesting the people building these Releases do not do a good job, they most certainly do. But when you consider the best possible job all Regular Release maintainers possibly could do and compare it to the much broader masses of the entire open source ecosystem, how did we ever think this problem was light enough for such narrow shoulders?
A Different Perspective
I’ve increasingly come to the realisation that not only is change unavoidable in software, it’s desired. It not only happens in Rolling Releases, but it still happens in Regular Releases.
Instead of trying to avoid it why don’t we embrace it and deal with any problems that brings?
Increasingly I hear more and more users demanding “we want everything stable forever, and secure, but we want all the new features too”.
Security and Stability cannot be achieved by standing still.
New Features cannot be easily added if good engineering practice is discouraged in the name of appearing to be stable.
In software as complicated as a Linux distribution, quite often, the right way to make a change requires a significant amount of changes across the entire codebase.
Or in other words “in order to be able to change any ONE thing, you must be able to change EVERYTHING”.
Rolling Releases can already do that, and you can read my earlier blog post if you haven’t already for some reasons why Tumbleweed is the best at that.
But it’s not enough, otherwise I would have been running Tumbleweed on my servers 4 years ago.
I Am A Lazy Sysadmin
Before my life as a distribution developer I was a sysadmin, and like all sysadmins I am lazy. I want my servers to be as ‘zero-effort’ as possible.
Once they’re working I don’t want to have to patch them, reboot them, touch them, look at them, or ideally even think about them ever again. And this is a hard proposition if I am running my server on a regular Rolling Release like Tumbleweed.
Tumbleweed is made up of over 15,000 packages, all moving at the rate of contribution. Worse, Tumbleweed is designed as a multi-purpose operating system.
You can quite happily set it up to be a mail server, web server, proxy server, virtualisation host, and heck, why not even a desktop all at the same time.
This is one of Tumbleweed’s greatest strengths, but in this case it is also a weakness.
openSUSE has to make sure all these things could possibly work together. That often means installing more ‘recommended packages’ on a system than absolutely necessary, ‘just-in-case’ the user wants to use all the possible features their combination of packages could possibly allow.
And with this complexity comes an increase of risk, and an increase of updates, which themselves bring yet more risk. Perfectly fine for my desktop (for now), but that’s far too much work for a Server, especially when I typically need a Server to just do one job.
Minimal Risk, Maximum Benefits with openSUSE MicroOS
openSUSE MicroOS is the newest member of the openSUSE Family. From a code perspective, it is a derivative of openSUSE Tumbleweed, using exactly the same packages and integrated into its release process, but from a philosophical perspective, MicroOS is a totally different beast.
Whereas Tumbleweed & other traditional distributions are multi-purpose, MicroOS is designed from the ground up to be single-purpose. It’s a Linux distribution you deploy on a bit of hardware, a VM, a Cloud instance, and once it is there it is intended to do just one job.
- The package selection is lean, with all you need to run on bare metal if you install from the ISO, or even smaller if you choose a VM Image for a platform where hardware support isn’t necessary. Fewer packages mean fewer reasons to update, helping lower the risks of change traditionally introduced by a rolling release. Recommended packages are disabled by default.
- Being a transactional system, it has a read-only root filesystem, further cutting down the risk of changes to the system, ensuring that any unwanted change that does happen can be rolled back. Not only that, but such roll-backs can be automated with health-checker.
- With rebootmgr, I can even schedule maintenance windows to ensure my updates only take effect during times I’m happy with.
Auto updating, auto rebooting, auto rolling back? I can be a lazy sysadmin even with a rolling release!
Just One Job Per Machine?
MicroOS is designed to do just one job, and this is fine for machines or VMs where all you would want to do is something like a self-maintaining webserver. That is as a simple as runningtransactional-update pkg in nginx.
But that can be rather limiting. Wouldn’t it be nice if there was some way of running services that minimised the introduction of risk to the base operating system, and could be updated independently of that base operating system?
Oh, right, that already exists, and they’re called containers.
MicroOS makes a perfect container host, so much so we deliver VM Images and a System Role on the ISO which already comes configured with podman.
Especially now openSUSE has a growing collection of official containers, a good number of services are a simple podman run podman pull registry.opensuse.org/opensuse/foo away.
In my case, I have moved all of my old Leap servers to now use MicroOS with Containers, this includes
- NextCloud, using upstream containers [1][2][3][4]
- Jekyll, using an upstream container [5]
- Nginx, using the official openSUSE container [6]
- A custom salt-master container [7]
- A custom SSH container acting as both a jump-host and backup target for all my other machines [8]
- and some other containers which I hope to make official openSUSE Containers once I’m happy they’ll work for everyone
All of the custom containers are built on openSUSE’s tiny busybox container which is just small and tiny and magical and I have no idea why anyone would use alpine.
All of my servers are now running MicroOS. The software is newer with all the latest features, but through a combination of containerisation and transactional-updates I find myself spending significantly less time maintaining my servers compared to Leap.
I can update the containers when I want, using container tags to pin the services to use specific versions until I decide when I want to update them.
I can easily add new containers to the to the MicroOS hosts just by adding another systemd service file running podman to /etc/systemd/system.
And I never need to worry about my base operating system which just takes care of itself, rebooting in the maintenance window I defined in rebootmgr.
I’m going to be writing further blog posts about my life with MicroOS and podman , but meanwhile I couldn’t be happier, and sincerely hope more people take this approach to running infrastructure.
Why? Well, we’re still only human, but when things do go wrong it’ll be even easier with more people looking at any problems :)
Now all I need to do is see if any of these benefits make sense for a desktop….

Introducing debuginfod service for Tumbleweed
We are happy to pre-announce a new service entering the openSUSE world:
https://debuginfod.opensuse.org
debuginfod is an HTTP file server that serves debugging resources to debugger-like tools.
Instead of using the old way to install the needed debugging packages one by one as root like:
zypper install $package-debuginfo
the new debuginfod service lets you debug anywhere, anytime.
Right now the service serves only openSUSE Tumbleweed packages for the x86_64 architecture and runs in an experimental mode.
The simple solution to use the debuginfod for openSUSE Tumbleweed is:
export DEBUGINFOD_URLS="https://debuginfod.opensuse.org/"
gdb ...
For every lookup, the client will send a query to the debuginfod server and get's back the requested information, allowing to just download the debugging binaries you really need.
More information is available at the start page https://debuginfod.opensuse.org - feel free to contact the initiator marxin directly for more information or error reports.